Previously @raff and @ibacher and @dkayiwa have looked for places to improve backend responsiveness for the O3 frontend. Recently we weren’t sure whether the remaining issues/slowness were solely due to the need for requests to the backend to be grouped together, rather than many individual calls.
However, from a quick look with @dkigen, there are several specific calls taking notably long. It seems we should rally some folks to track down some of these “problem calls”, and work on better optimizing those ones specifically.
A few practical examples:
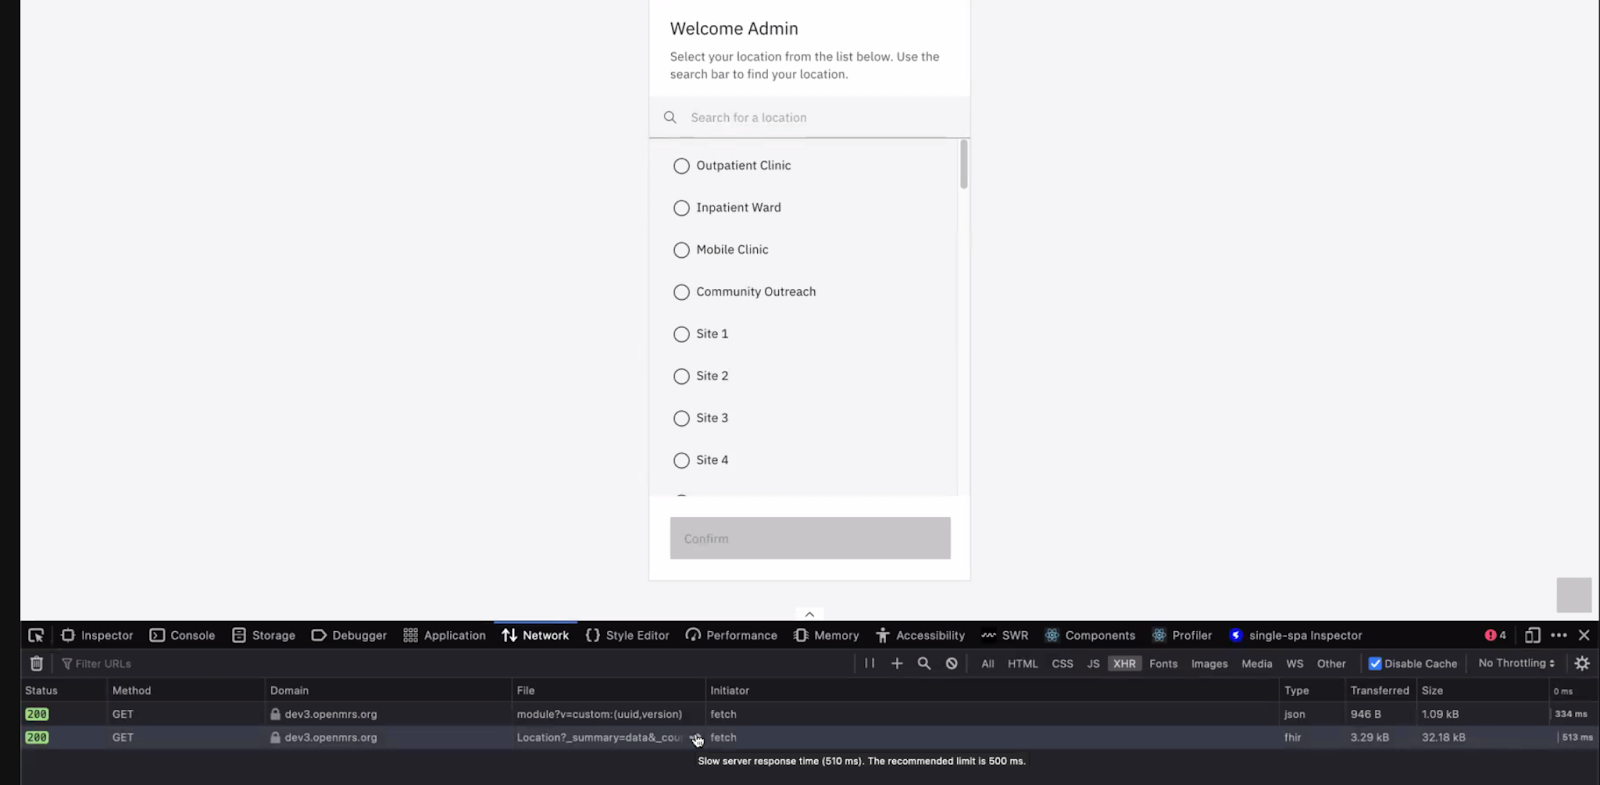
1) >500ms to fetch location on the Location Picker page (yikes, since this is the first page after login users experience!)
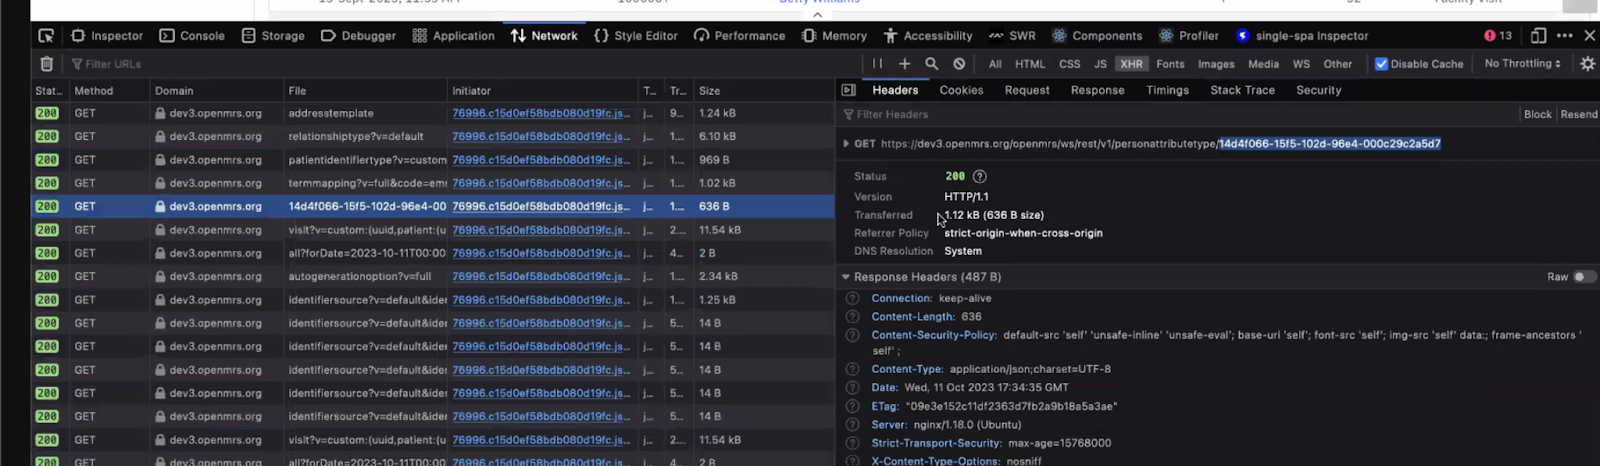
2) 3 seconds to fetch this person attribute type (slows patient chart loading):
If I open in a different tab the resource openmrs/ws/rest/v1/personattributetype/14d4f066-15f5-102d-96e4-000c29c2a5d7 it takes 82ms to get the result ( but not sure if a cache is used on server side).
Confirmed together that this is not random spiking; results with some both REST and FHIR endpoints being slower (>700ms - 3s) are consistent
Clarified: What is our goal?@ibacher and @dkigen I said 500ms as a good benchmark to head towards just based on chrome’s advice that the recommended limit be 500ms; however, human perception is much lower than that. So as a start: let’s prioritize things giving users a delay of >1 second.
Next Step:@dkayiwa will coordinate a time with @raff and @dkigen and @ibacher to go through and prioritize those. May want to target dev3 (or test3 since we just did a QA-Release) or compare to local to check if there’s slowness just because of how we set up dev3/test3.
Others also welcome to contribute any suggestions esp if you’re seeing delays of >1 second - e.g. thanks so much @frederic.deniger for the examples!
@grace I think some care needs to be taken with how we’re benchmarking things here. For example, in the first screenshot, the request for the login locations indeed takes over 500ms. However, if I run the same request on my local, it takes about 200ms and if I run it directly on the same server, about 170ms. If you look at the same screenshot, the response for the request to get the list of installed modules takes 334ms, but locally for me, around 34ms (I didn’t measure this on the server). This means that the bulk of the slowness in the test here is due to network latency (apparently on the order of 300ms).
Now, even 170ms is probably a bit slower than we want, and there’s probably a low-effort way to speed that up further, by actually adding an index on the location_tag.name column, which we need to search to filter the logout locations.
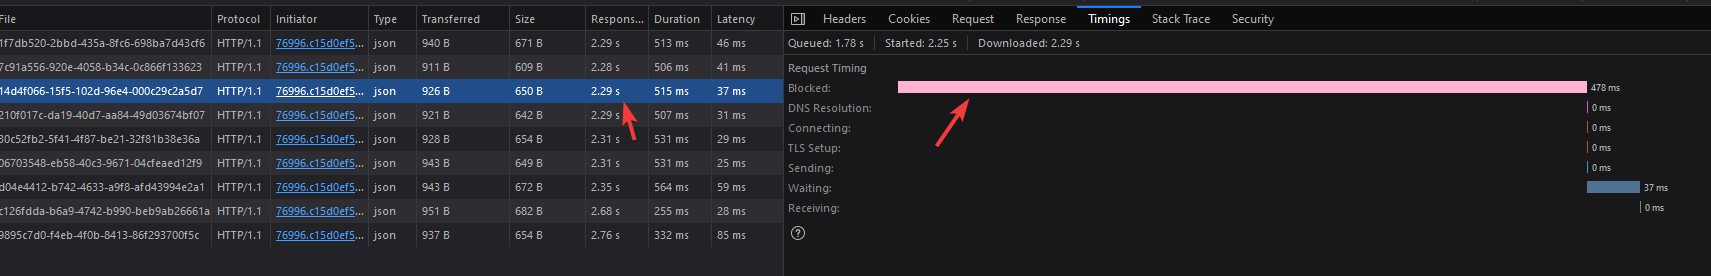
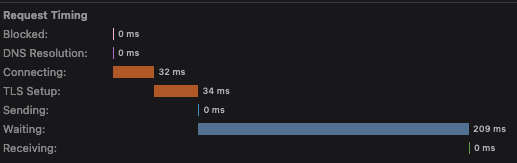
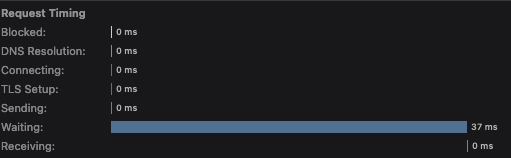
I sort of suspect (but can’t tell because no timing data is in the screenshot) that something similar is going on with the 3 second thing. In any case, dev3 should not be used for performance sampling, because it redeploys relatively frequently and makes some dev-specific assumptions and when we do, we need to have a decent measure of network latency. The browser dev tools detailed timings can give a very useful breakdown. For example, here are the timings for my browser from the request for locations and the request for modules:
In the first screenshot, we see some additional latency (~64ms) due to the TCP handshake and TLS startup. This can help us factor out some of these issues.
I did some (too) quick tests in our environments ( 10k locations) and didn’t notice big slowness on the backend side. My tests are probably not completely relevant as I didn’t try to flush cache on the backend. Maybe the call to openmrs/ws/rest/v1/idgen/identifiersource?v=default&identifierType= seems to be slow ( 140ms) as it seems it’s a very simple call and it requires almost more time than the locations call.
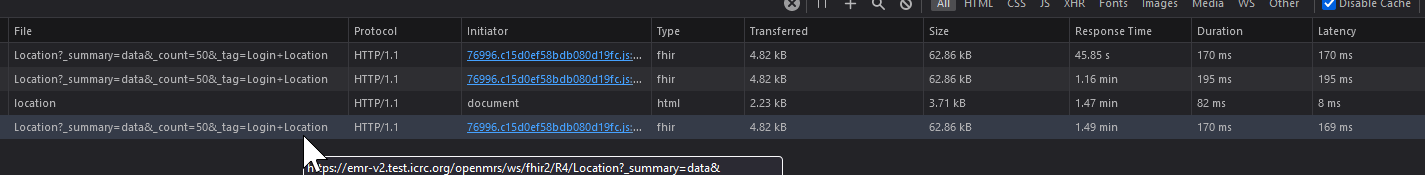
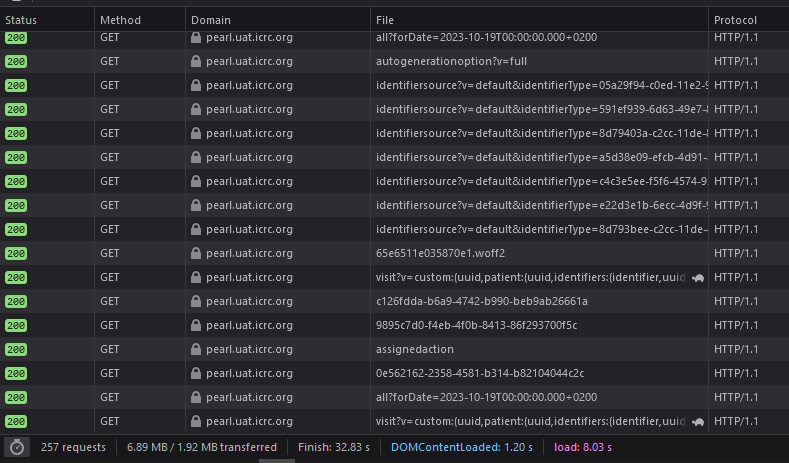
On our side (ICRC), the issues seem to be more on the frontend : for instance 253 requests are needed to load the home page and we need 6s to make it visible with a “usual” network ( 3Mb, 57 ms latency). But it’s a lot more with bad connection ( > 100 ms latency) that some of our users are facing ( and some pages can’t load).
You are correct. We did not discuss this on today’s platform call.
Apart from the clearly obvious TRUNK-6204, i have not yet identified a backend endpoint that would result into noticeable improvements in the O3 slowness. I feel like the realistic next step is to group unnecessarily chatty frontend requests into a smaller numbers, like is suggested with this ticket O3-2505.
To be precise, the next step would be identifying such calls in the frontend app and creating the corresponding tickets. That will define the needed backend work for cases where the required end point does not exist.
At this stage, this is all frontend investigation and hence it would be more efficiently done by the frontend leads. If none has time for it, i can take it up. But be warned that i would need to first deep my head in the frontend code.
Go to test3.openmrs.org (since this has the lastest ‘stable’ build of O3)
Open the dev tools (right click → inspect)
Click the “Network” tab. Click around to trigger things. I like to filter by the Time column and then you can directly interrogate which calls/actions are taking a while, and as you’ll see in the video below, it even gives you a nice visual on what exactly in that call is taking a while.
30-second demo for you here:
@dkigen@ibacher@burke anything else you’d add to guide Daniel here, or does that about sum it up?
Confirmed w/ @ibacher that what I demo’d above is all that we need you to do @dkayiwa to explore Especially if you filter with a focus on FetchXHR on Chrome you just click this button:
@janflowers i never got time to do this. My suggestion is that we get a volunteer to do the steps outlined in that video, and report on which calls/actions are taking long. Then i can dive into looking for the solutions.
The volunteer does not need to find the cause of the slow responses. All that he or she needs to do is go through the above three steps that @grace recorded in the video and report the findings. It is from this report, that i can get started with looking for the cause and solutions.
@lumuchris256 is the above something that you are interested in doing?