yes i did , just a few observations am making on the calls in reference to what @ibacher mentioned here before sharing the report doc link in a few
the additional latency factors in for most reducing the previously thought high response time
yes i did , just a few observations am making on the calls in reference to what @ibacher mentioned here before sharing the report doc link in a few
the additional latency factors in for most reducing the previously thought high response time
@dkayiwa @grace is there a ticket that @lumuchris256 can add his report to showing what he found?
For this reporting I took call reponse time records on 3 different days from the test3 OpenMRS server
, which gave different reponse times for each day , tested using different bandwidth (internet providers’ speed) gave different response times again
observation affecting response time include :
as shown in this report here
Conclusively
Discovered the calls are greatly affected by internet speed , with fast internet they are <500 , with slow internet wildly >500 otherwise all are averagely below 500 response time on good internet
@grace any other criteria or standard I might need to test by ?
Nice job @lumuchris256! @dkayiwa from his report it looks like this is a consistent culprit:
https://test3.openmrs.org/openmrs/ws/fhir2/R4/Location?_summary=data&_count=50&_tag=Login+Location
So is the next step @dkayiwa for you to see what’s delaying that particular call?
@dkayiwa can you please look through the report from @lumuchris256 and see if there are other things that you need him to look into? Are there pieces that @lumuchris256 can work on fixing with your guidance (such as the location call)?
The potential fix for this was done with [TRUNK-6204] - OpenMRS Issues. Because we generally try to avoid back porting database changes to maintenance branches, this commit was not back ported to the 2.6.x branch which test3 is running.
@dkayiwa and I discussed next steps - @lumuchris256 here is how we recommend proceeding:
Again I’d like to say, your report from your testing was fantastic.
(FYI @dkigen @ibacher @jayasanka @vasharma05: This has really made us more aware that if we optimize backend calls, there’s no way online instance where we can test platform version increases / fixes!! Let’s talk about that this week together.)
@lumuchris256 can you test dev3.openmrs.org? I have just updated it to temporarily use the latest snapshot version of the platform (2.7.0-SNAPSHOT)
FTR, I’ve resisted updating to 2.7.0-SNAPSHOT because we need an actual release of the backend when we do a release of the application and I don’t think we wanted to force a release of 2.7.0 that way. The difficulty is that if we update to 2.7.0-SNAPSHOT, but release with 2.6.x, then whatever ends up on the QA server is effectively untested.
This was more of a proof of concept where @lumuchris256 tests and reports back on the performance effects for that particular call. Then we immediately revert back to 2.6.x (The plan is for dev3 not to be running 2.7.0-SNAPSHOT for more than one day)
@lumuchris256 are you in position to do that by the end of today?
yeah sure on it already, doing the necessary observations
Thank you so much @lumuchris256 - can you let us know ASAP when you are done, so we can revert the platform version back? Reason for some urgency: Platform 2.7.0-snapshot is currently causing all the E2E tests to fail which prevents Frontend feature devs from getting accurate E2E test feedback.
I’m sorry, I didn’t expect this.
Done with the observations , can revert back to 2.6.x @dkayiwa @grace @ibacher
the report using Dev3 is referenced here
Bravo @lumuchris256 that was so fast!! Wow your report findings are very interesting - the Location call we thought would be fixed or improved got worse.
Now that dev3 is reverted back to platform 2.6.x, @lumuchris256, do you mind testing again using this dev3 server to see if there is any difference in peformance?
So, this is just going to be an unedited dump of some thoughts on performance. Apologies.
The Visits view in the O3 frontend as it currently exists is unworkable.
To power the Visits view (which is very cool), we currently use a call like the following:
/ws/rest/v1/visit?patient=<patientUuid>&v=custom:(uuid,encounters:(uuid,diagnoses:(uuid,display,rank,diagnosis),form:(uuid,display),encounterDatetime,orders:full,obs:full,encounterType:(uuid,display,viewPrivilege,editPrivilege),encounterProviders:(uuid,display,encounterRole:(uuid,display),provider:(uuid,person:(uuid,display)))),visitType:(uuid,name,display),startDatetime,stopDatetime,patient,attributes:(attributeType:ref,display,uuid,value)&limit=5
For one of the demo patients (Betty Williams - 7521943e-dd1a-4e27-9b29-bb4241c52bef) each page of 5 results takes 20 seconds to return to my computer (which, it’s well-established that dev3 → me is faster than it is for most people). I think the issue here is that the query requires a large number of joins, which, in turn, results in a large number of individual queries being run on the backend. Hopefully, we could create an API endpoint customised to getting just the subset of data we need for this that would perform better than that (we’ve had reports of this taking over 60 seconds with real-world data, i.e., this vaguely-worded ticket). The data returned is also on the order of 2.5MB, which seems excessive. (This query also doesn’t properly implement pagination, so it just keeps requesting the same 5 visits again and again and again).
Not directly performance, but the call here to get the list of concepts for the test page doesn’t seem to be working correctly. Specifically, it’s not actually chunking the concepts into sets of 10 as intended, but just sending 4 batches of requests for 40 different concepts, all of which fail with an HTTP 414 error (URI Too Large)
Marginally performance related: it would be nice if the IDGen identifiersource endpoint could take multiple identifiertype arguments and return all the sources that match any of them. Currently, we need to do one request per identifier type, which is not ideal, especially as the overhead of individual requests often contributes to the perceived slowness of the app.
We end up with a lot of calls like this: /ws/fhir2/R4/Observation?subject:Patient=<patientUuid>&code=5085AAAAAAAAAAAAAAAAAAAAAAAAAAAAAAAA%2C5086AAAAAAAAAAAAAAAAAAAAAAAAAAAAAAAA%2C5087AAAAAAAAAAAAAAAAAAAAAAAAAAAAAAAA%2C5088AAAAAAAAAAAAAAAAAAAAAAAAAAAAAAAA%2C5092AAAAAAAAAAAAAAAAAAAAAAAAAAAAAAAA%2C5090AAAAAAAAAAAAAAAAAAAAAAAAAAAAAAAA%2C5089AAAAAAAAAAAAAAAAAAAAAAAAAAAAAAAA%2C5242AAAAAAAAAAAAAAAAAAAAAAAAAAAAAAAA%2C165095AAAAAAAAAAAAAAAAAAAAAAAAAAAAAA%2C1343AAAAAAAAAAAAAAAAAAAAAAAAAAAAAAAA&_summary=data&_sort=-date&_count=100. It think this is from the vitals and biometrics app. Each of those requests takes on the order of 2 seconds, mostly processing server-side.
We have requests like this: /ws/fhir2/R4/Condition?patient=<patientUuid>&_count=100&_summary=data that are not nearly as bad, but still take between 600ms and 700ms to return.
Right now, the query to get the list of concepts associated with Vital Signs looks like this: /ws/rest/v1/concept/?q=VITALS%20SIGNS&v=custom:(setMembers:(uuid,display,hiNormal,hiAbsolute,hiCritical,lowNormal,lowAbsolute,lowCritical,units)). This works, and it’s not per se a performance issue, but it only works on the assumption that there is just one concept in the dictionary named “Vital Signs” and that its a concept set. It would be nice if we had an API to request a concept by exact name.
We definitely need some kind of guidance about setting up caching properly on the server, because the O3 frontend really depends on files being cached for a very long time to be performant.
Since bandwidth usage has also been brought up: my run through with no caching on the first request and caching for everything else resulted in 7.61 MB of data over the wire of which 6.19 MB was code, CSS and fonts, meaning that the actual use of the app accounted for 1.52 MB or ~25% of the total transferred. (If you’re wondering how that squares with my assertion that the visit endpoint alone accounts for 2.5MB per request, well, it was both cached and all requests end up GZipp’ed so it’s 2.5MB of data, but only 225kB of data over the wire).
cc: @janflowers @paul
Thank you @ibacher for this listing! The question now is how do we operationalize addressing performance across the entire OpenMRS product? Do these become a team initiative to run sprints, or work on individual tickets as these things are discovered, or other ways of approaching it? @dkayiwa thoughts?
Thanks @ibacher from the observations above
How about pagination
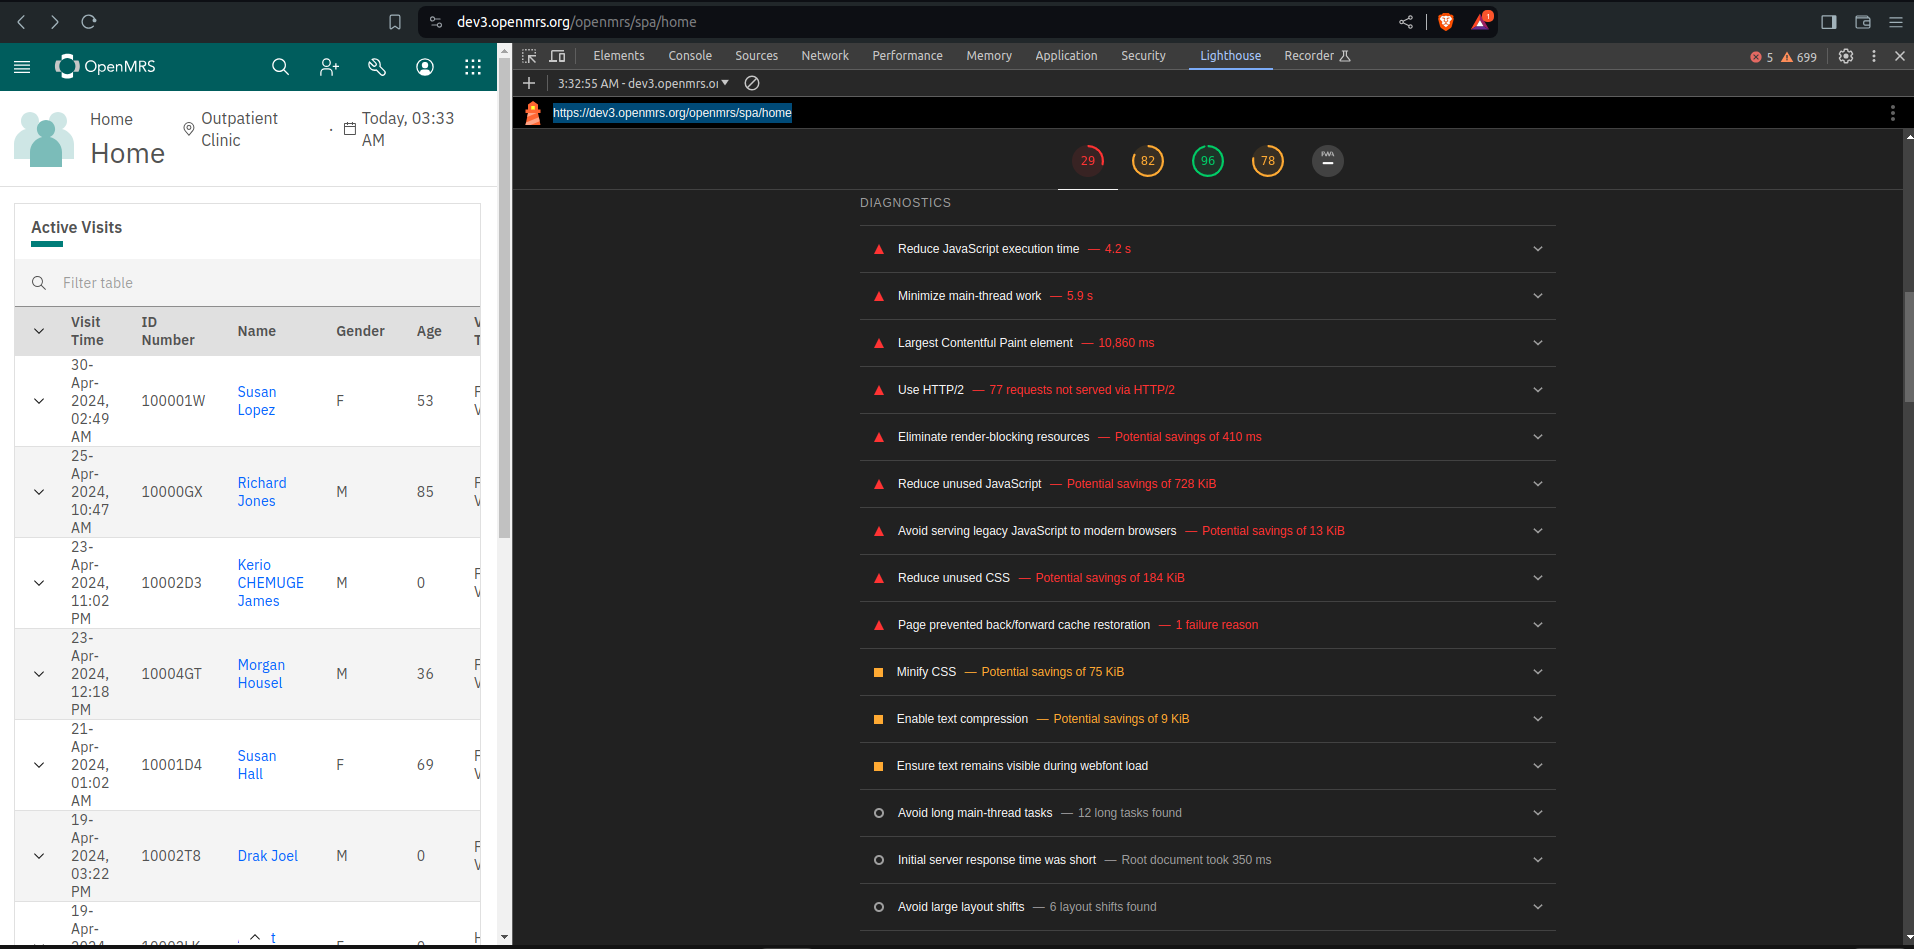
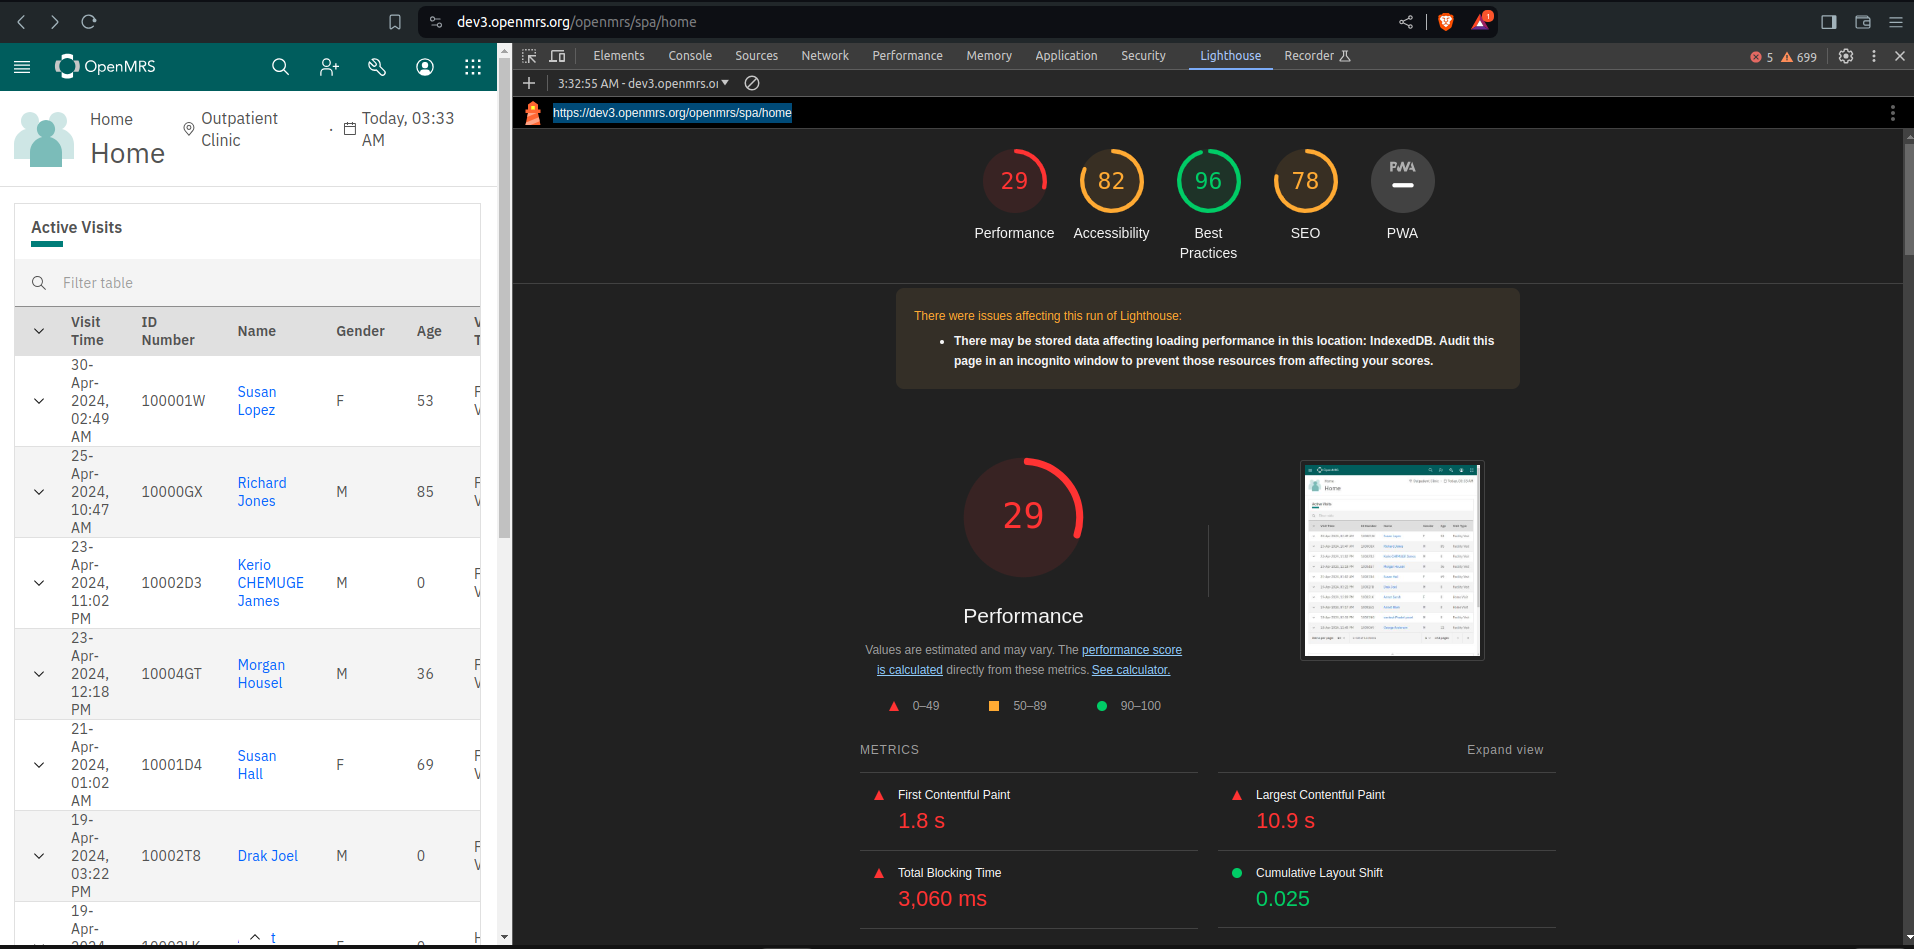
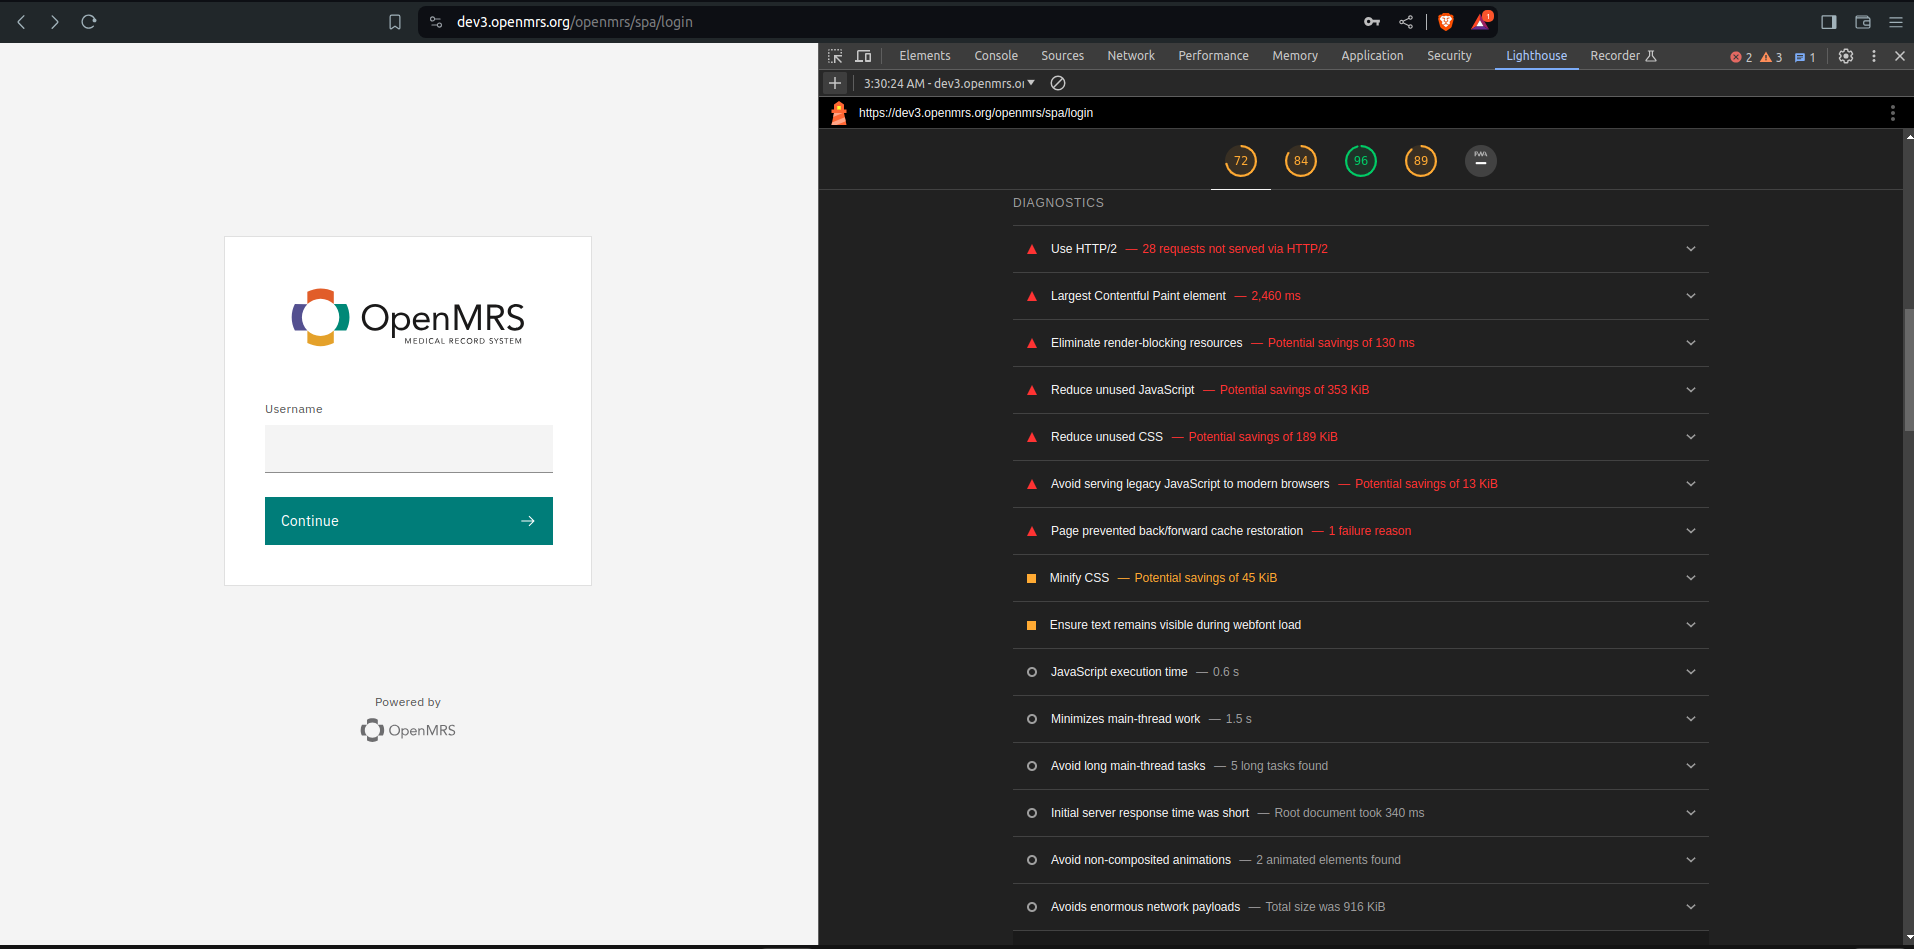
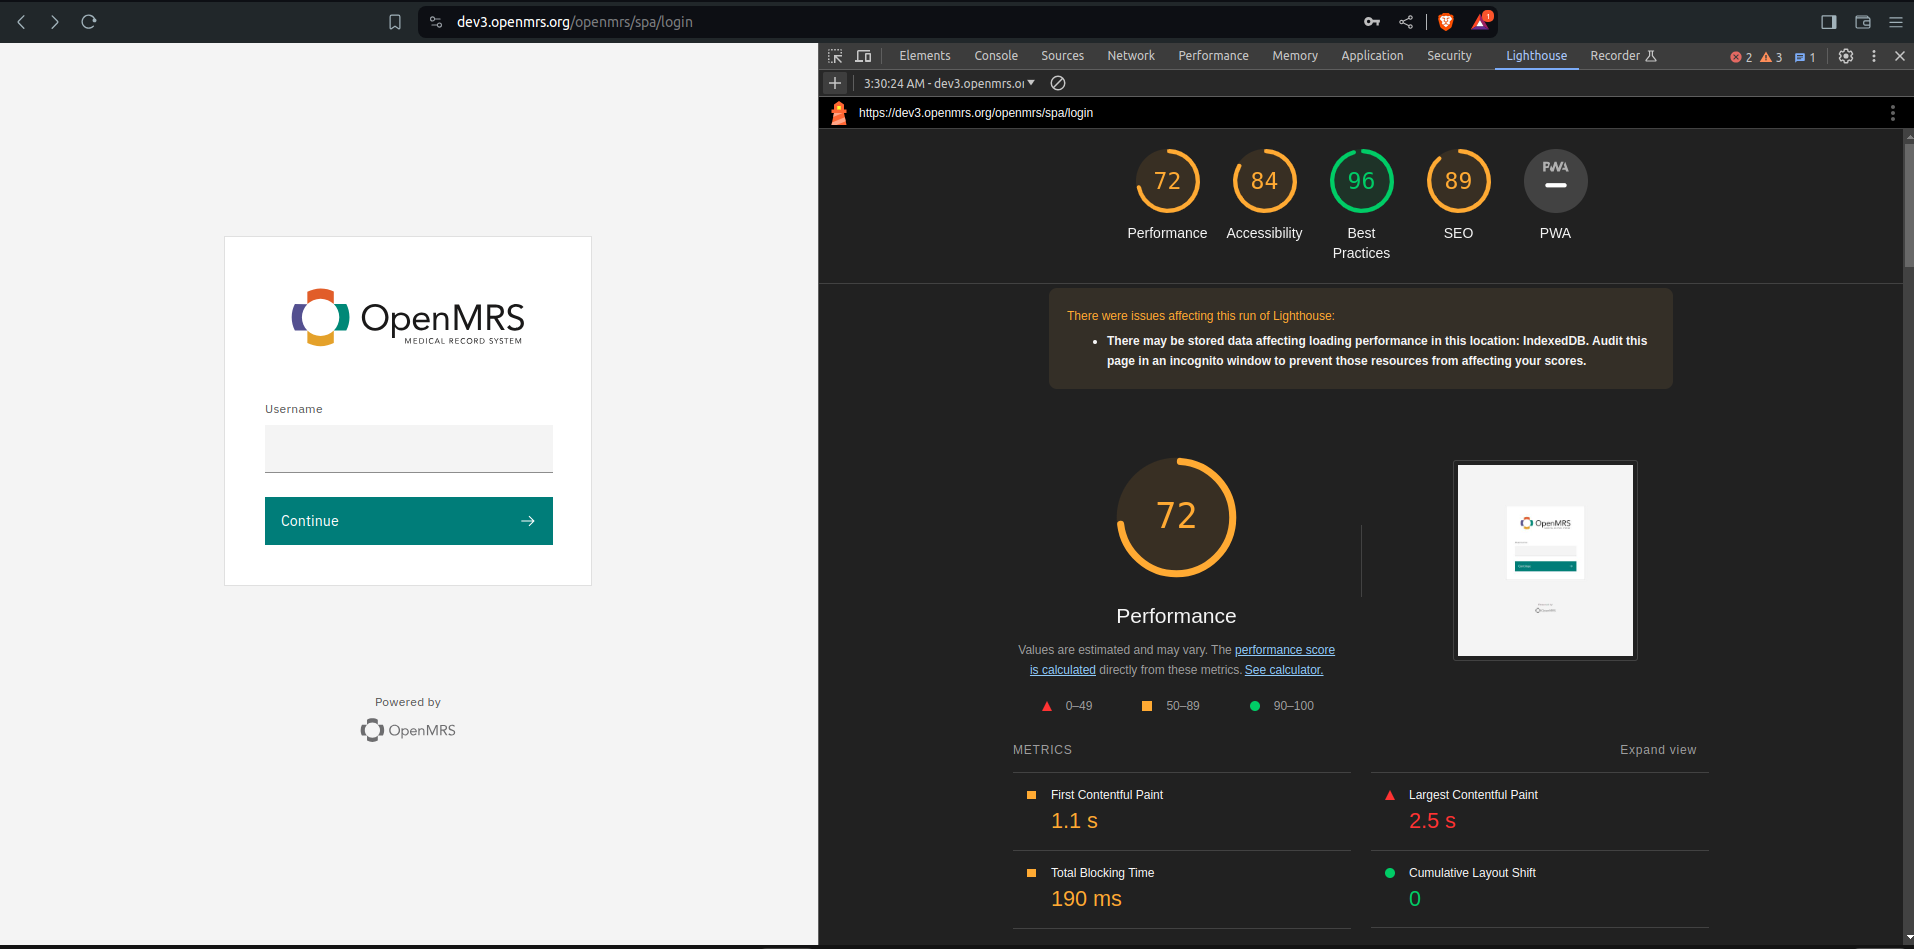
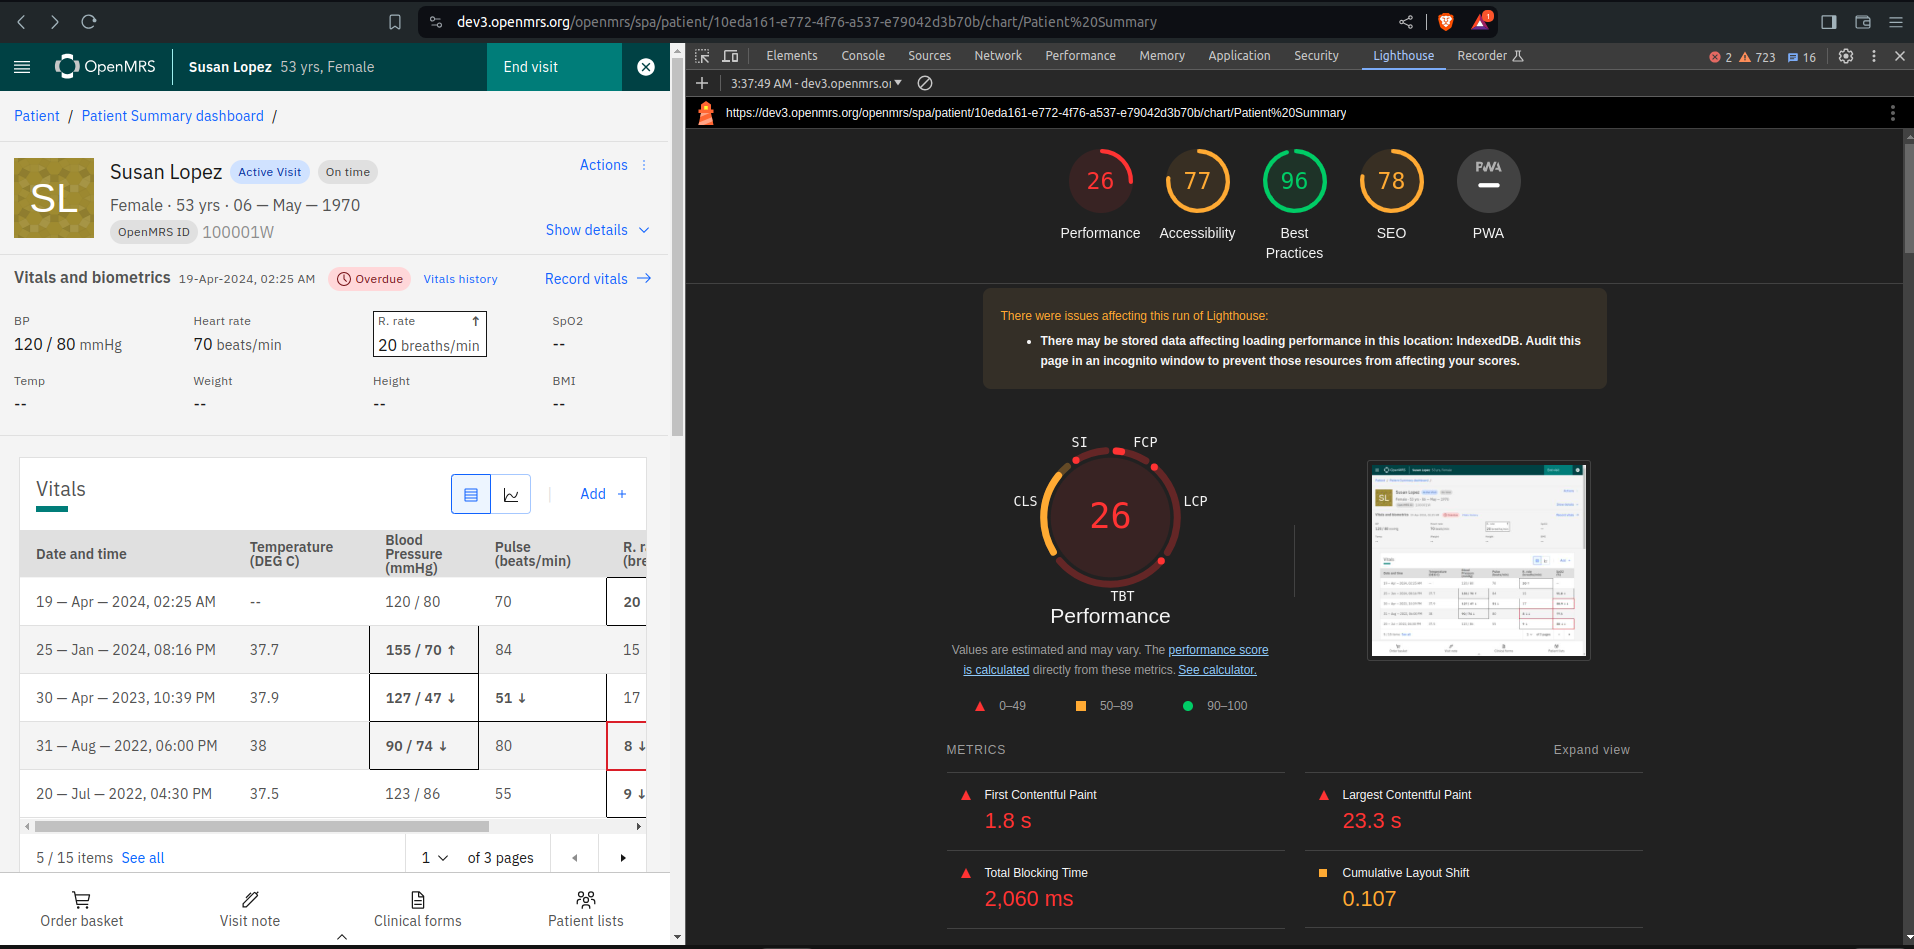
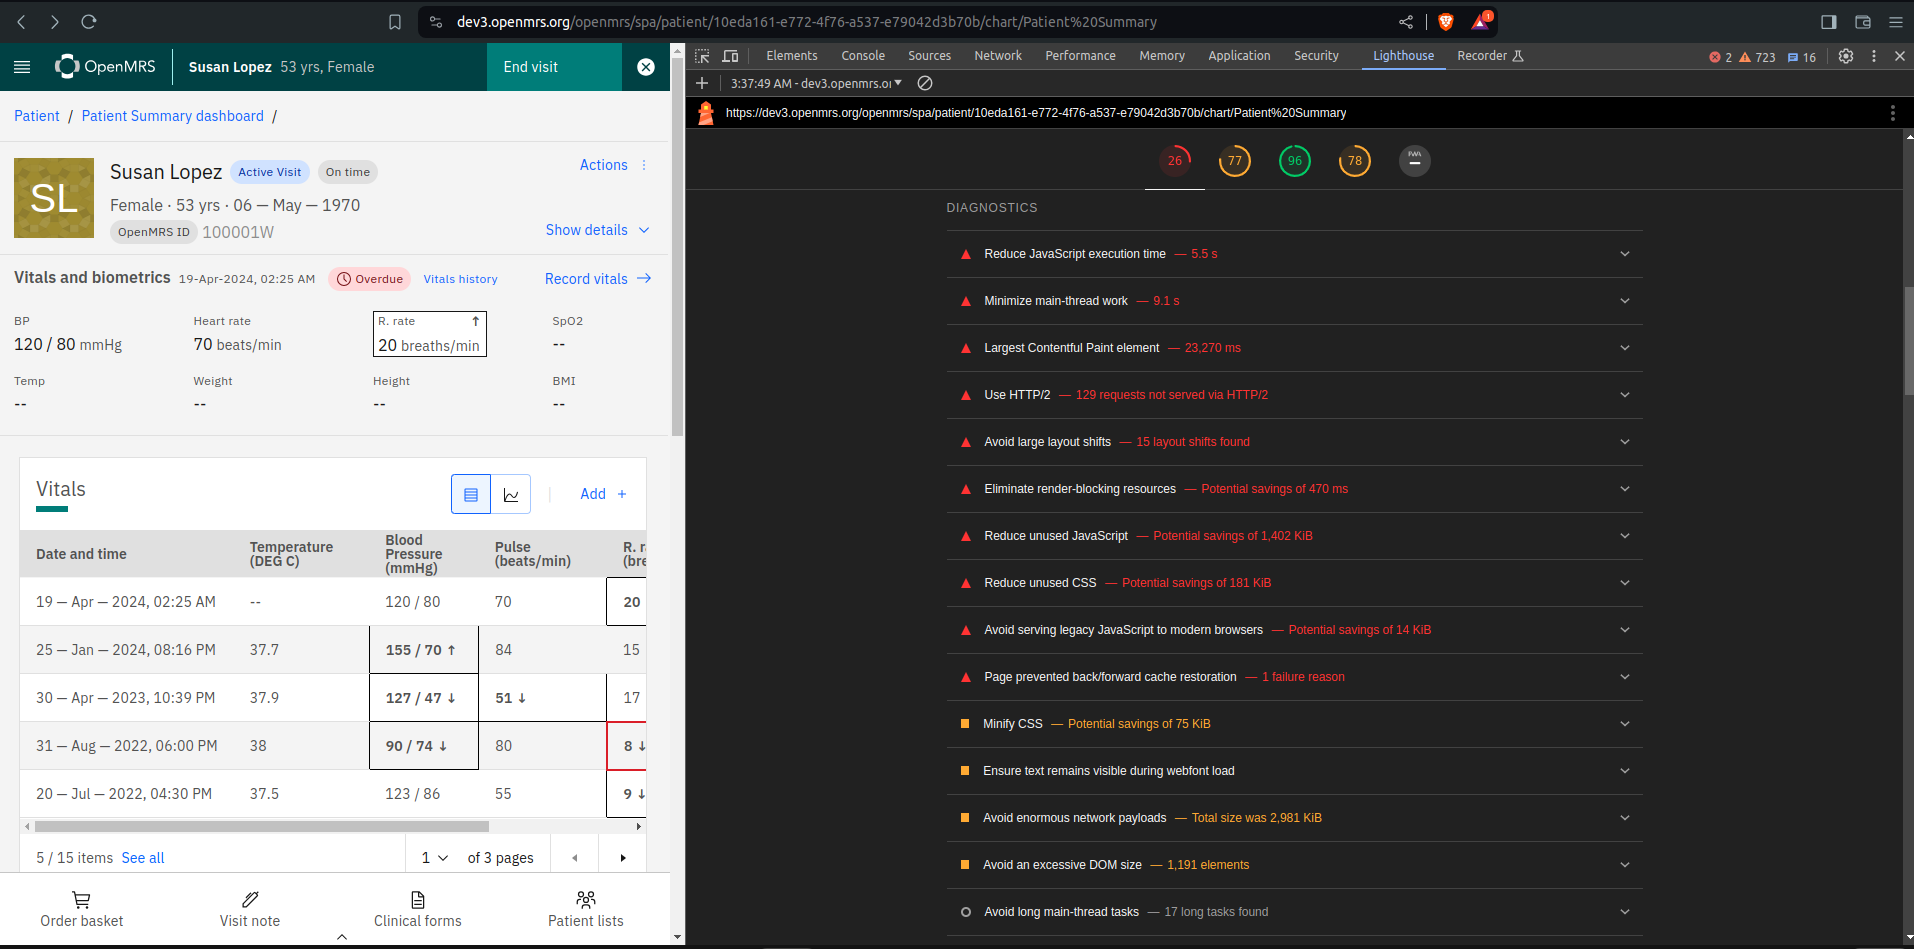
Here are some of my findings using lighthouse
Home screen https://dev3.openmrs.org/openmrs/spa/home
Perfomance
Patient Dasboard performance and load time
@janflowers I would vote for working on individual tickets as these things are discovered.
For the https://test3.openmrs.org/openmrs/ws/fhir2/R4/Location?_summary=data&_count=50&_tag=Login+Location call that @lumuchris256 listed in his report, my recommendation is that we change it from using FHIR to the end point provided by the webservicesrest module: https://test3.openmrs.org/openmrs/ws/rest/v1/location?tag=b8bbf83e-645f-451f-8efe-a0db56f09676&limit=50
This call is already 4 times faster than the FHIR one. And i have just made a commit to make it 2 times faster, than what it already was, with this ticket: [RESTWS-934] - OpenMRS Issues hence eventually making it 8 times faster than the FHIR one. Which, on my computer, while connecting to a local O3 backend, translates from an average of 300ms to 35ms.
And when a custom representation of something like custom:(name,uuid) is used for the webservicesrest end point, it will also save on the bandwidth, as less data is sent over the wire.
The performance problems of the FHIR end point are caused by these two lines below during the translation from OpenMRS to the FHIR format:
This results into extra unnecessary database calls for each location that is returned. With the _count=50 parameter, it means 50 * 2 = 100 extra database calls.
Is there a reason why we do not just use the webservices REST equivalent /ws/rest/v1/condition?patientUuid=<patientUuid>&limit=100 which, out of the box(without any attempt to optimise it), is 3 times faster?