We know OpenMRS 3, as a React-based single page app with most of the behavior happening in the client browser instead of on the server as with OpenMRS 2.x, is moving a lot more code and data. We now have some examples of OpenMRS 3 use in the field where clients are communicating to a centrally-hosted server and bandwidth usage is dramatically higher than 2.x (e.g., just over 3 GB a month with 2.x becoming nearly 90 GB a month with O3).
In discussions about backend optimization, we’ve identified some calls (like Visits view that are pulling large amounts of data… perhaps more than necessary) and measured traffic showing that ~75% of it may be code. There are also likely many places where use of custom representations could reduce data sent over the wire.
Can we come up with a way of starting to measure and more readily expose OpenMRS 3 chattiness (i.e., bandwidth usage)? Rather than spending a lot of time setting up a framework to measure & test bandwidth usage, I’m thinking of one or two relatively easy to implement approaches that might help us identify the biggest opportunities for reducing bandwidth usage. For example:
Configure a proxy on one or more of a dev environments to log session ID, URL, response size, and response time. Such a log could be used to identify where the bulk of traffic exists.
Expose an optional counter in the UI that shows total cumulative network traffic for the web app that turns red as traffic exceeds a given target (and resets to zero when tapped), so devs & testers could easily monitor bandwidth usage and determine when/where there are spikes.
I think it’s worth emphasizing that the issue is largely not the chattiness of our APIs. It’s the heaviness of the underlying JS code. Easy to run experiment: on my machine, opening the dev tools, disabling caching, then opening dev3 and logging in and clicking on a random patient chart uses 4.80 MB of bandwidth (measured by the tab) of which 4.44 MB is just Javascript file and 300kB is just assets (CSS + fonts). That leaves ~70kB of traffic that’s actual data requests.
The reason I’m emphasizing caching is that with caching enabled correctly, the app traffic is substantially lower, i.e., with caching enabled, I can view the service queues, appointments, open up the patient chart and enter 3 orders and 3 forms all for under 1 MB of traffic. (For comparison, the 2.x version of KenyaEMR weighs in at about 330kB / page, so that 1 MB of traffic would get me about 3 screens).
Thank you so much@burke and @ibacher for looking into this. Extremely appreciated. This is definitely going to become a rising concern among implementations who don’t have the budget or operations ready for higher data amounts and costs - even if those costs seem trivial at first.
@aojwang what kinds of caching settings are in place at the sites where we’ve seen bandwidth concerns?
@ibacher thanks for the reassurance re. the API calls. I do have a question: Would there be any bandwidth consumption improvements if we had API call “bundling” methods? IIUC one weak-ish point of our REST API is the inefficiency of needing many calls instead of bundling those calls.
a Redis cache should come in handy to reduce latency caused by the doubled database calls on top of burden generated by the 03 JS addressed above.
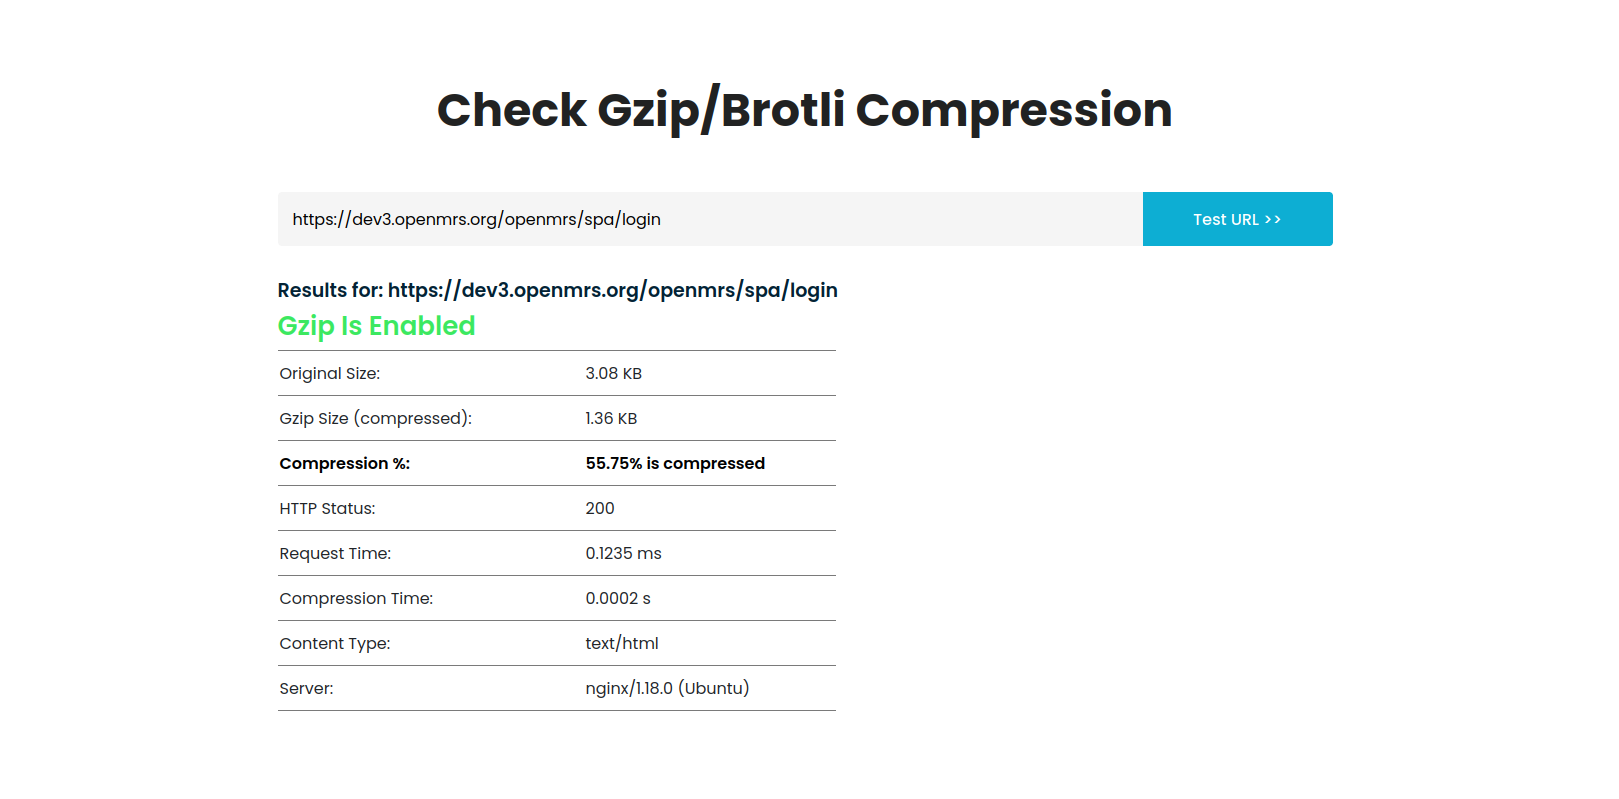
And finally since fhir calls have proven to have heavy payloads even for simple calls, incorporating data compression with Gzip(not sure wether we have this yet) should help cut down on the burden placed on the network caused by exorbitant loads and consequently cut down on data usage costs on the part of implementations.
For example Gzipping a simple 03 Login page yields a 55.57 % drop in data i.e from 3.08kb to 1.36Kb
At this point, I’m less concerned about speed performance of our demo sites and, rather, thinking of the real world client who was using 3 GB of data per month with OpenMRS 2.x and now is using nearly 90 GB of data per month (3 GB of clinical data and more than 80 GB of code). Caching on the server side won’t help this. It seems like we need to find a way to convince clients (browsers) to cache code & supporting files, only downloading those that are missing or changed.
@ibacher, you mean caching in the browser, right? Or perhaps, more accurately, the proper headers being supplied by the server to instruct/influence the browser to cache the code files locally and only fetch them when changed?
You are right, @ibacher. We use the module-spa in facilities but leverage nginx in our test instances.
I had asked our DevOps to prepare an installation/upgrade package that uses nginx even for the facilities. I just didn’t think it was urgent until we got feedback from the field
I don’t think it’s essential to be using NGinx at all (in fact, I’ve been considering backing that out altogether for a few reasons), but if the right caching headers are set, the RefApp is just under 10kB of overhead (non-data transfers) per page load vs the 4.4 MB figure I quoted above without them.
Thanks, @ibacher for this feedback. Which particular headers did you test with when testing refapp, and how can we take advantage of them in our deployments?
Thanks so much Burke <3 <3 I’m so grateful to how you and Ian and Antony are moving this forward here. Out of curiosity why did you mark the Epic as Low priority? If sites are actively rolling back from 3.x to 2.x because of bandwidth concerns, that seems pretty high priority - am I missing something? Was there a workaround identified that’s outside the scope of this Epic?