OpenMRS Load Testing Strategy

Excellent work @jayasanka! It’s really nice to have a clear visualization of this. I’ve got a couple of things I’d like to ask about for how we move forward.

First, is it possible to do a more gradual ramp-up of the number of users? Currently, it goes from 0-200 in under a minute. I think it would be useful to be able to more clearly visualize, say, steps like 10, 25, 50, 100, 150, 200 concurrent users.

Second, while useful, we’re somewhat hardware-limited in the current implementation. If we wanted to run this on different sized machines how hard would it be to translate what we have?

Thanks for the feedback @ibacher !

First, is it possible to do a more gradual ramp-up of the number of users?

Yes, it is totally possible. It’s configured here, (and we have the flexibility add user patterns if we want). Do you have any recommendations for the ramp up duration?

If we wanted to run this on different sized machines how hard would it be to translate what we have?

It’s configurable, we can either edit existing load type or introduce a new one here.

@rugute what would you estimate is your peak concurrent usage across all sites at AMPATH – i.e., what is the maximum number of concurrently active users across all clinics? And can you estimate the number of simultaneous users you might have if providers at MTRH hospitals were using the same system on a busy day?

@mksd what is the peak concurrent usage you expect for implementations using Ozone HIS? Do you see larger implementations or inpatient implementations exceeding more than 150 active users at any given time?

@mogoodrich / @mseaton at PIH’s largest implementations (in terms of user base), do you see more than ~150-200 concurrently active users of OpenMRS systems?

FYI – While supporting a relatively large county hospital (~300 beds) in the US with thousands of users, Regenstrief typically saw concurrent users of ~400 with peaks to 500. So, I’d suspect targeting support for up to 150-200 concurrent users for now to take us a long way and tackling the ability to scale horizontally (i.e., cluster OpenMRS instances) in the future to target up to 400-500 concurrent users would allow OpenMRS to perform in larger multi-site or inpatient contexts.

@burke Just to be clear, the reason we’re targeting a max of about 200 users is do to the resource constraints of the GitHub Actions runner that both hosts the EMR and the performance tests themselves, which are: 15Gi RAM, 4CPUs, and 73G disk space. This is somewhere around the size that we’d expect for a server supporting a single clinic. I would anticipate that larger servers can support substantially larger loads, but I don’t think it would make much sense to use substantially larger loads in the current setup.

Do you have any recommendations for the ramp up duration?

It would be nice to test for longer. I suggested six steps, so maybe we run each step for 30 minutes? that will give us both some nice ramp-up visibility and some reasonable longitudinal information (does performance degrade after a couple of hours of hammering). What do you think?

Honestly, I haven’t looked at user numbers in a long time, but I highly doubt we get more than 150-200.

Take care, Mark

Recent Changes Update

Simulation Structure

  • Simulation Tiers: Each simulation is divided into tiers, with each tier running for a specific duration. The user count increases gradually in each tier.
  • GitHub Actions Scheduled Run: The tier duration is set to 30 minutes, with 6 tiers. Starting from 0 concurrent users, the count increases by 32 in each tier, reaching ~200 concurrent users in the last tier. These numbers are configurable, and you can define your own preset here.

Current Presets

Preset Tier Count Tier Duration User Increment per Tier Ramp duration between tiers
Standard 6 30 min 32 1 min
Commit 1 1 min 20 1 min
Pull Request 1 1 min 20 1 min
Dev env TIER_COUNT env TIER_DURATION_MINUTES env USER_INCREMENT_PER_TIER 1 min

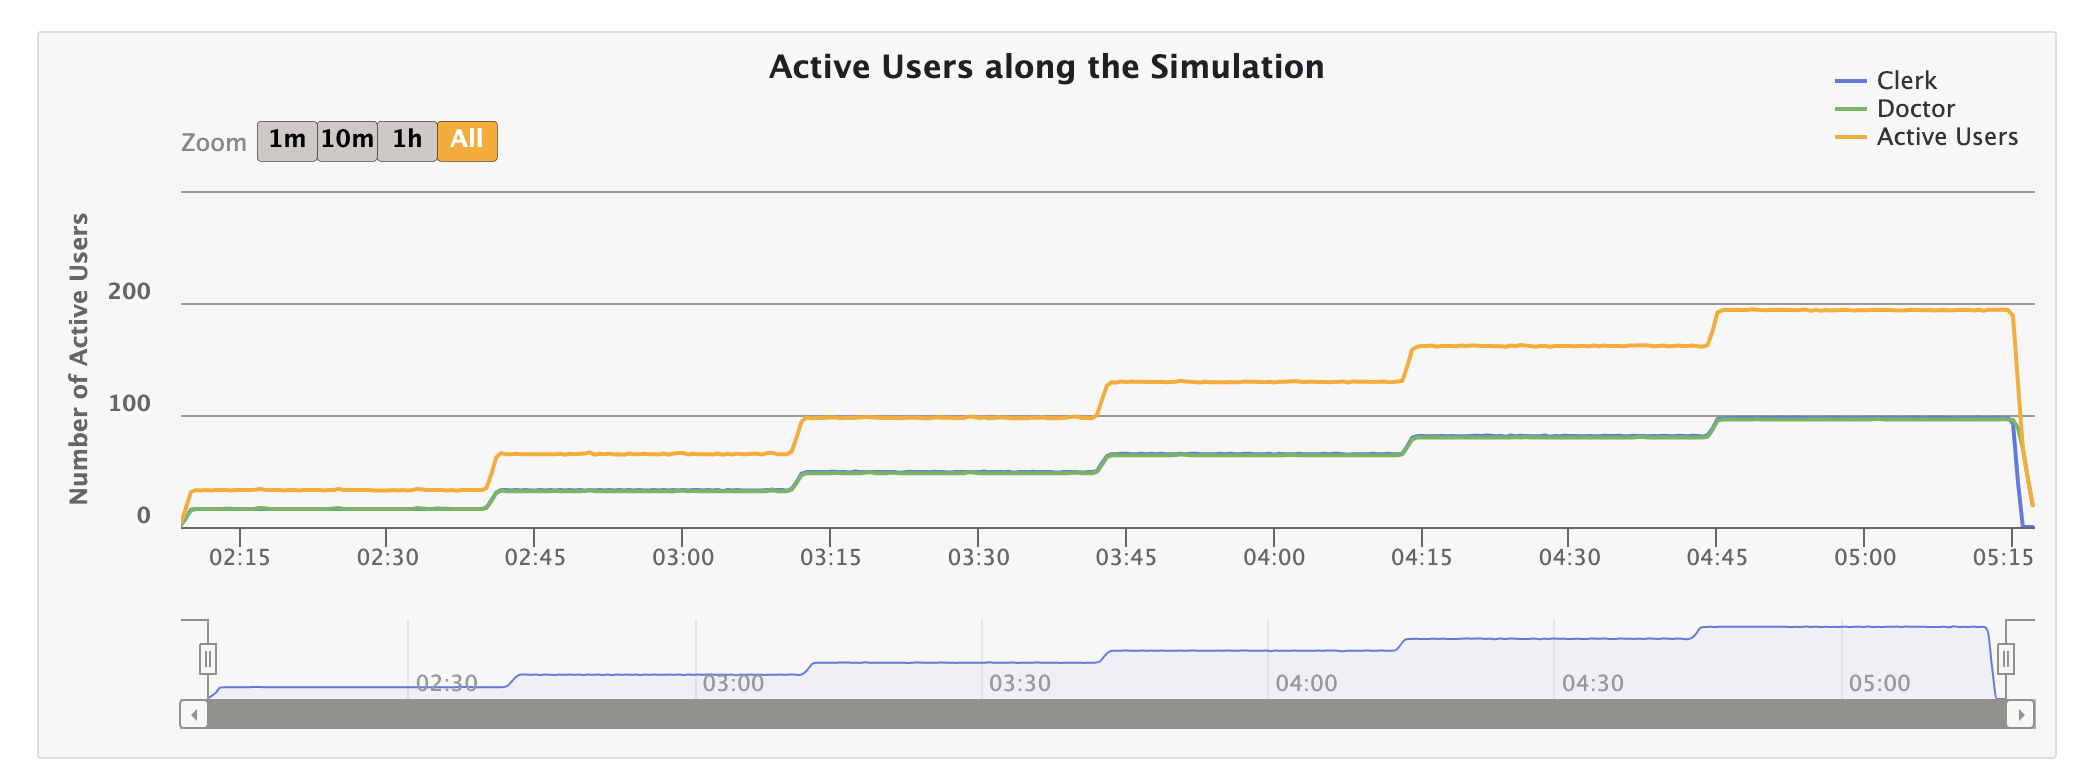
Active Users Over Time

Here’s a screenshot from the last report, showing the active users in the simulation over 3 hours:

Class Structure for Organization

To enforce better organization, I used a class structure with inheritance. More details are explained here.

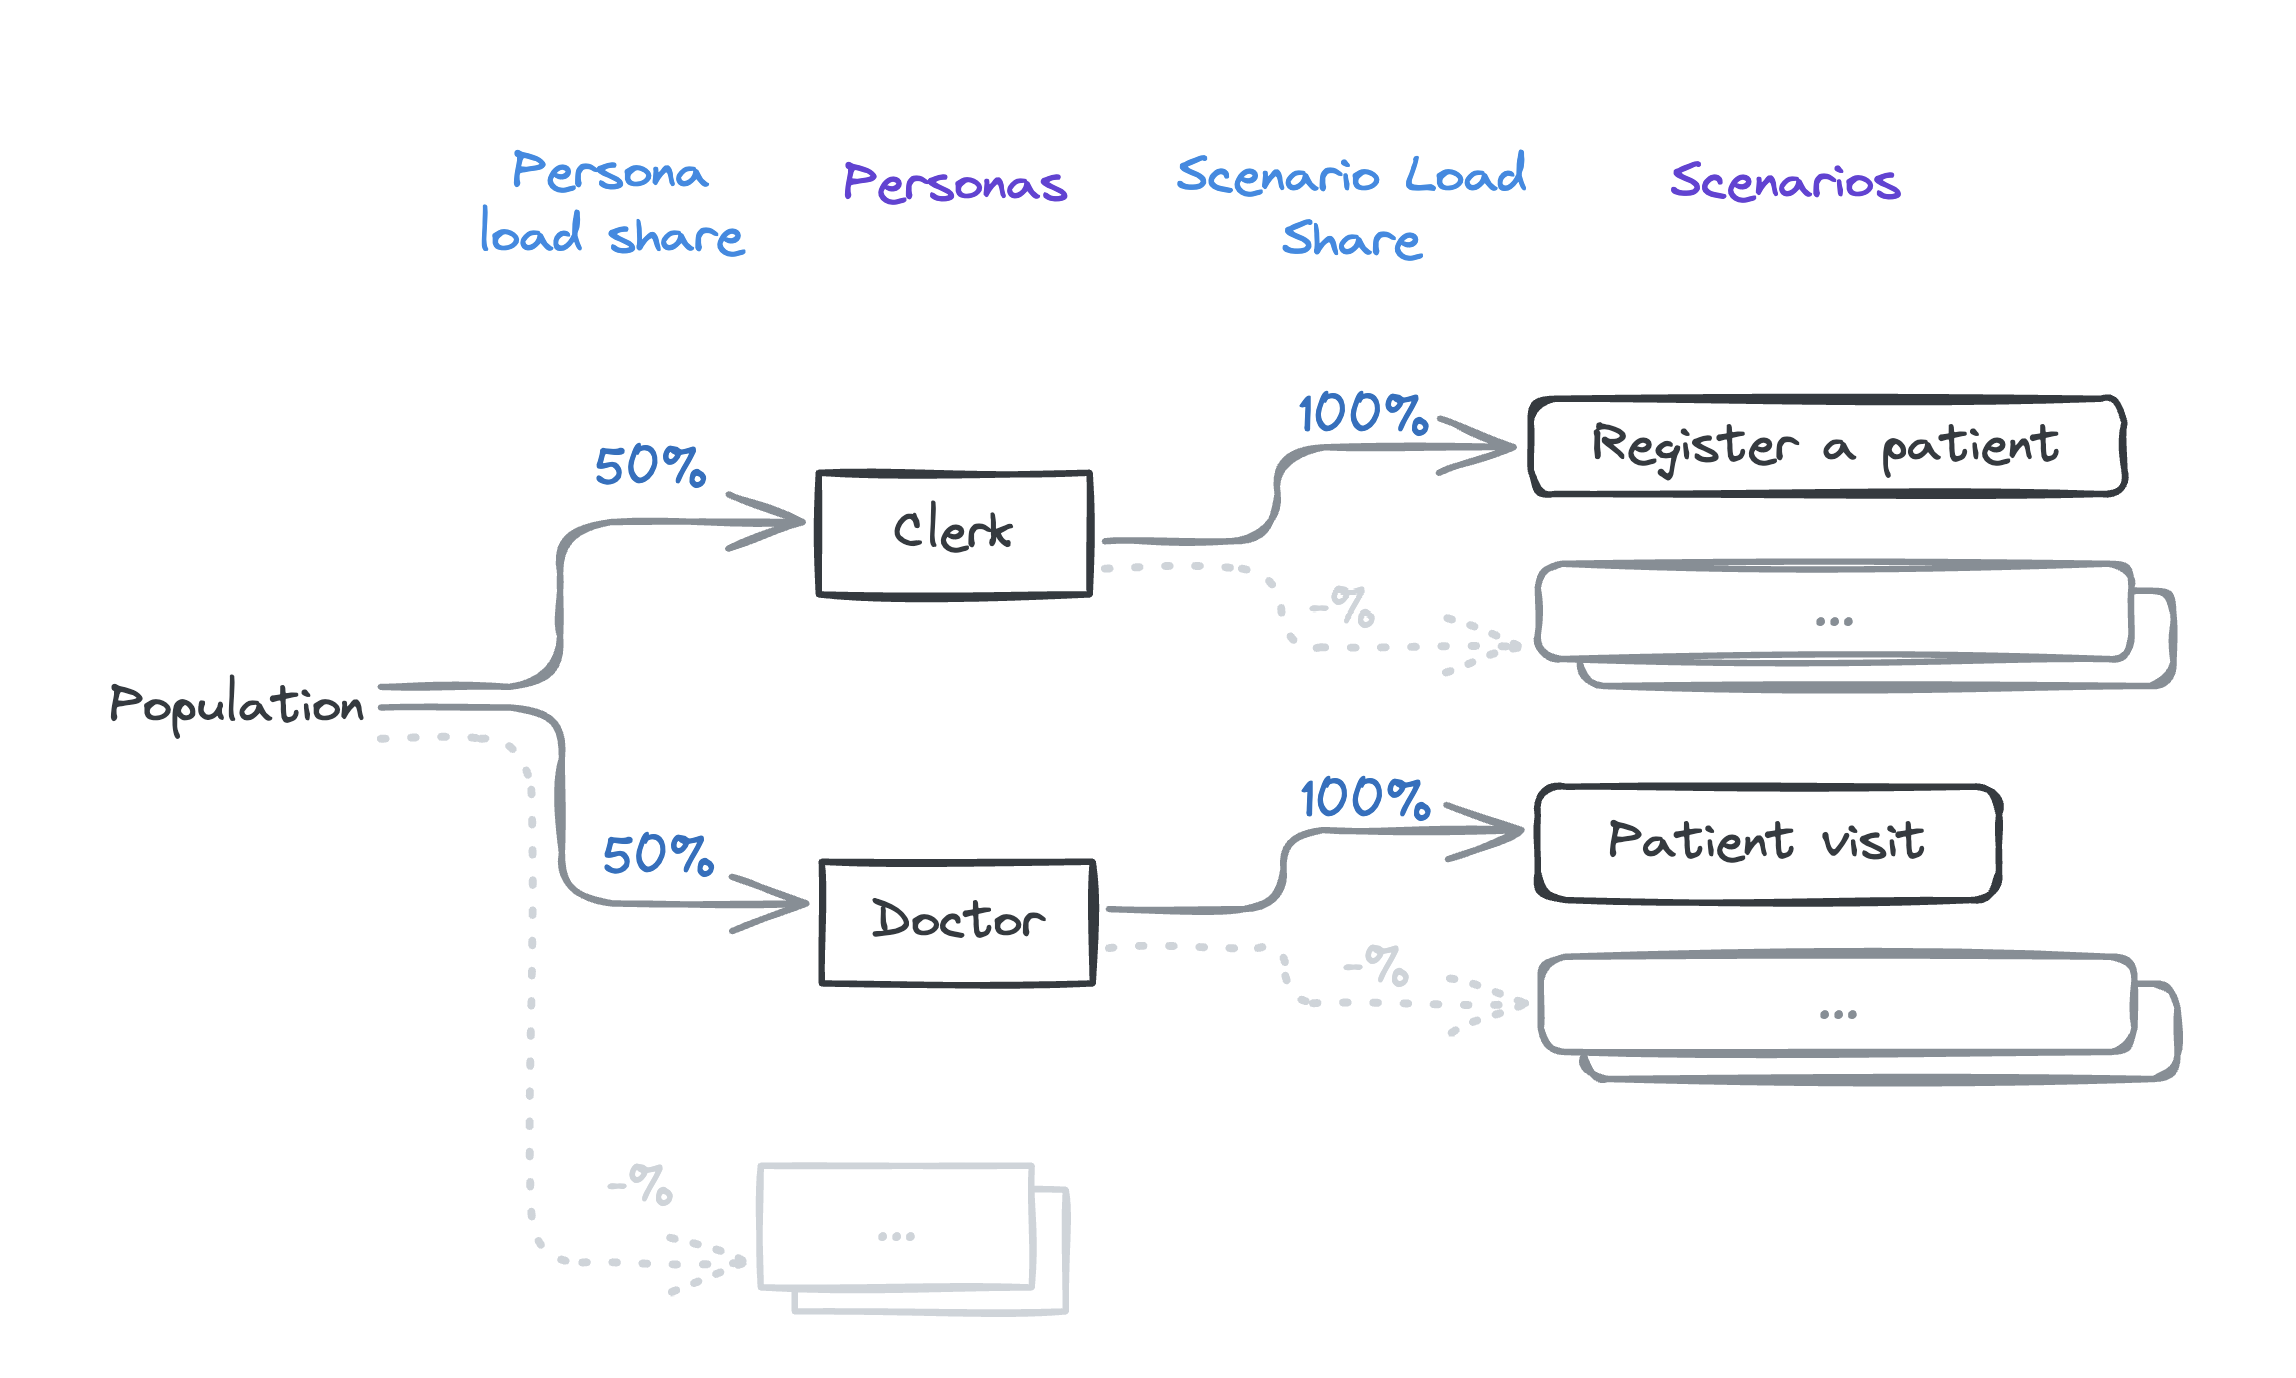
Personas and Scenarios

Here are the current personas and scenarios:

Observations and Analysis

Latest report: o3-performance.openmrs.org

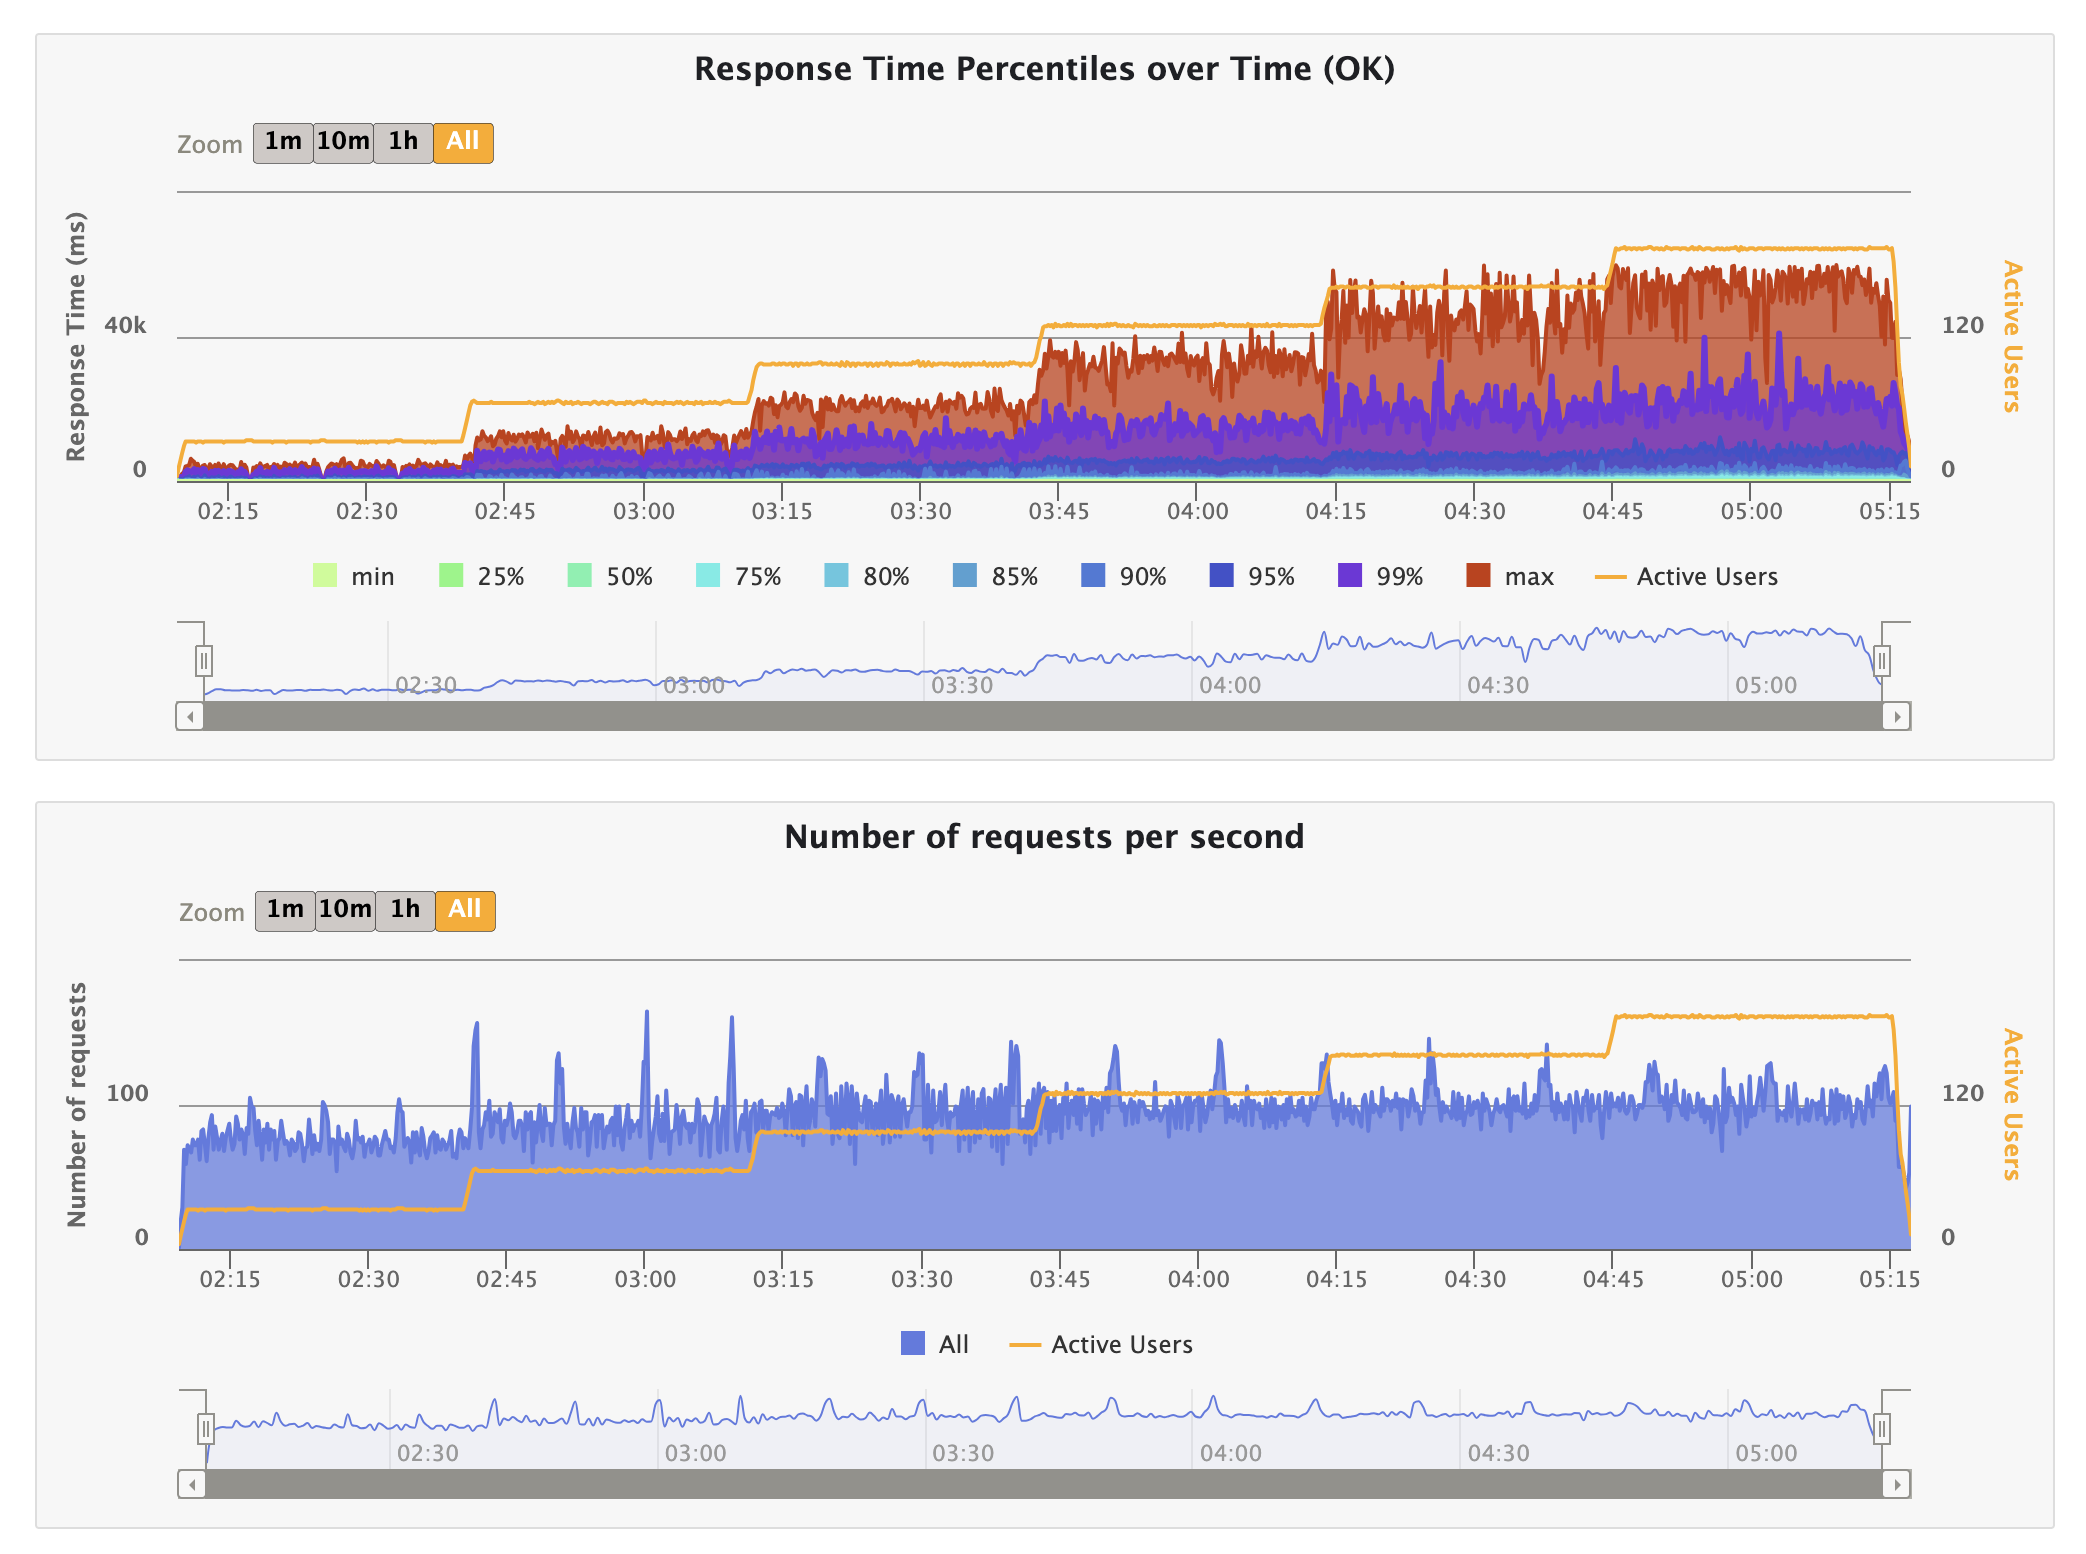
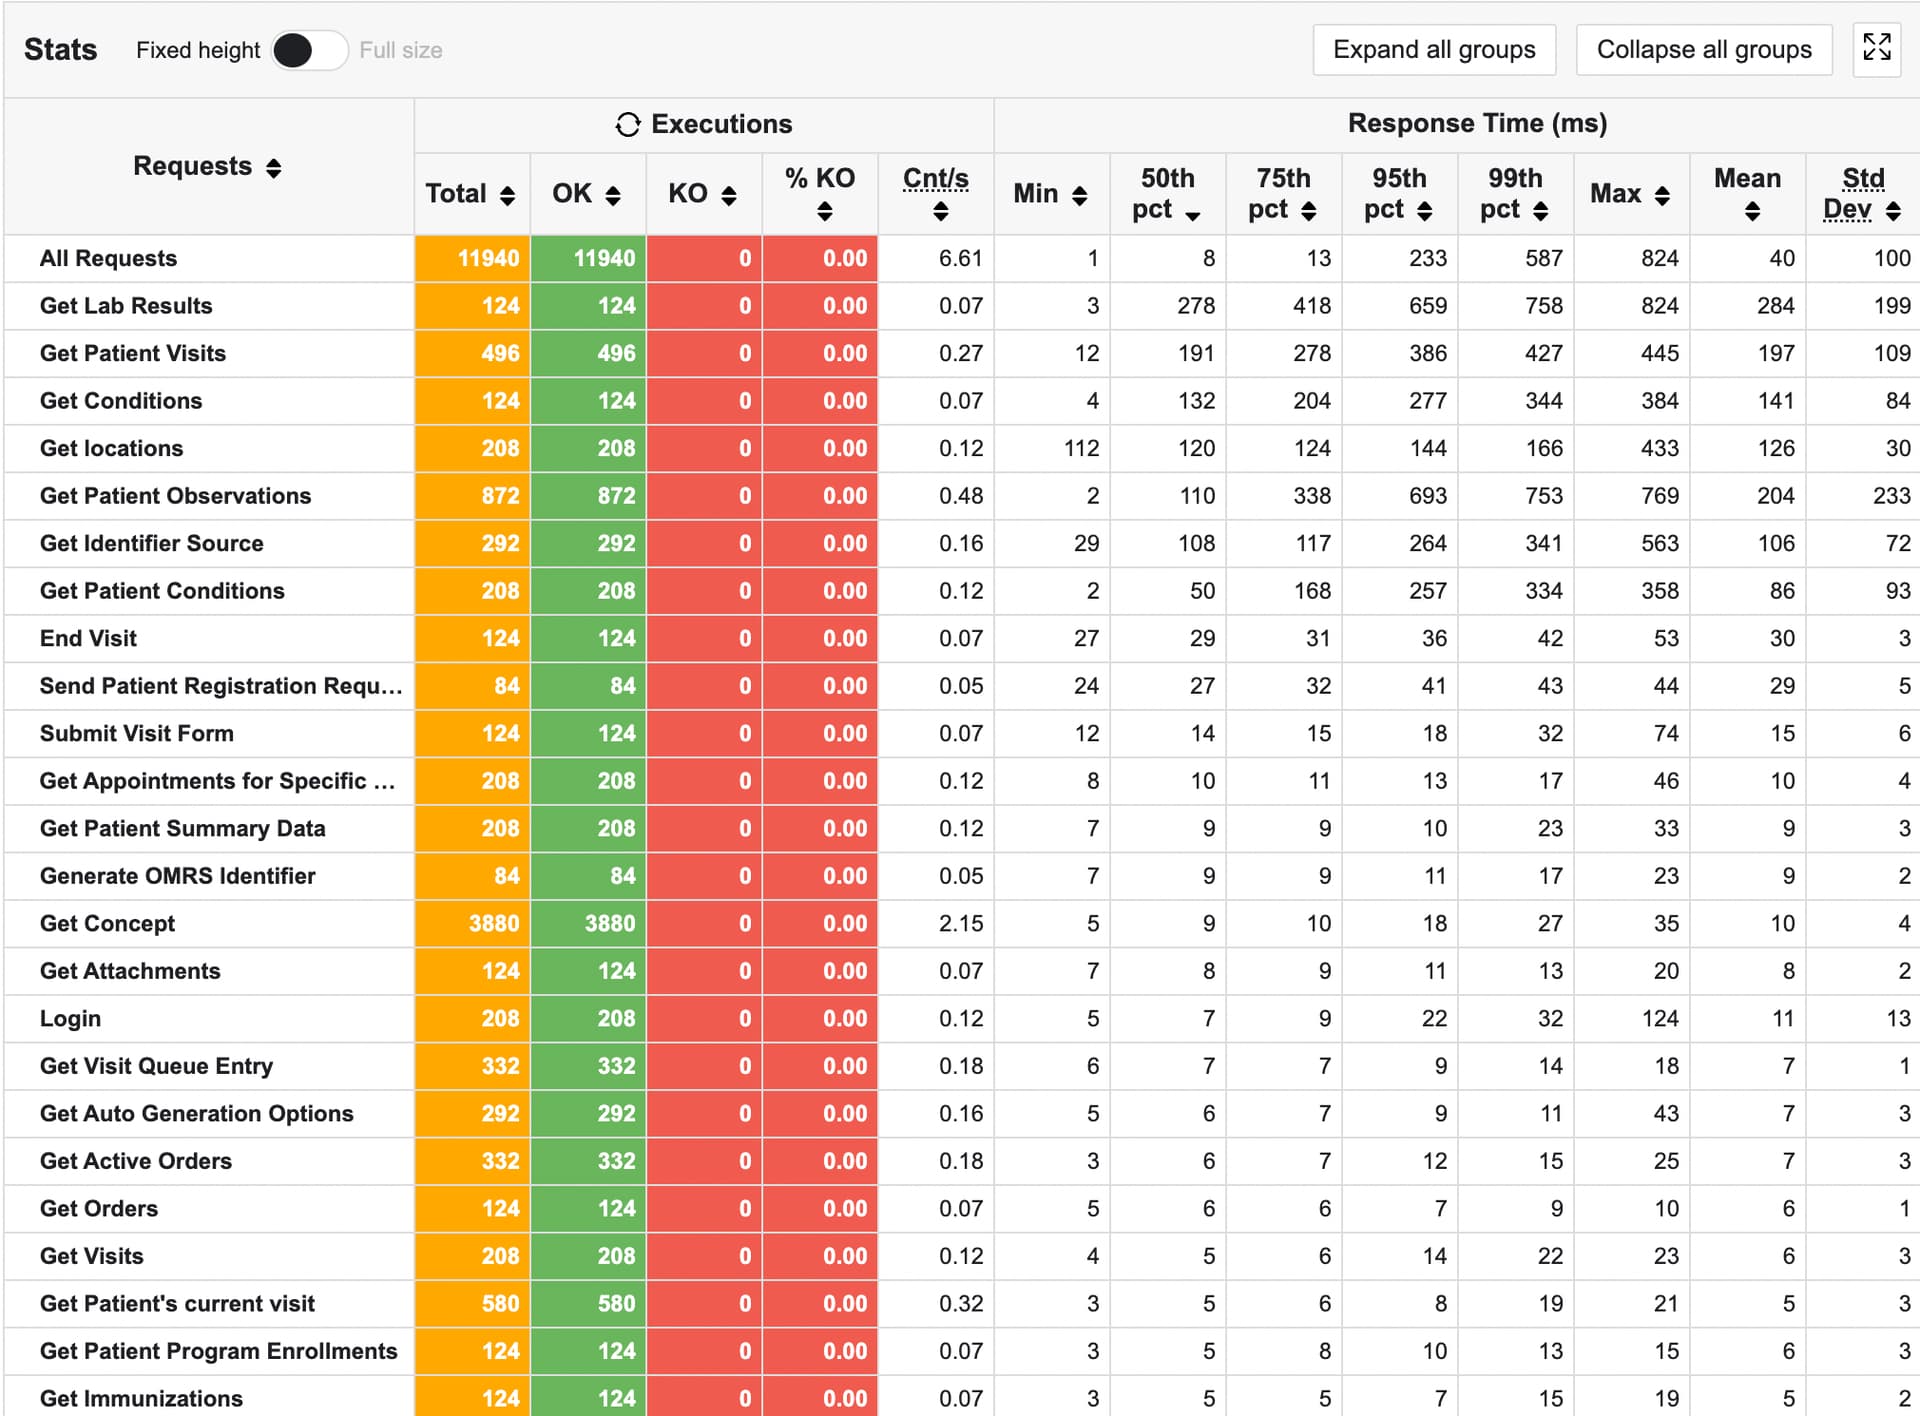
Response Time and Active Users

During the last platform call, we observed that response times increase with the number of active users. (Recording; Platform Meeting - Indiana University)

Here’s a screenshot illustrating this behavior:

Explanation of Behavior:

  1. Fixed Capacity of Java Server:
  • The server can handle a limited number of requests per second based on hardware and network capabilities. E.g., if the server’s capacity is 120 requests per second, it can only process that many requests regardless of the number of users.
  1. Queueing Effect:
  • As user numbers increase, more requests are made concurrently. Due to fixed processing capacity, additional requests must wait in a queue, leading to longer response times.
  1. Database Load:
  • Increased user count leads to more database queries, which can slow down as it handles more concurrent operations, adding to the overall response time.
  1. Overall System Bottleneck:
  • Both the Java server’s processing capacity and the database load contribute to the bottleneck. Even if one is fast, the other can cause increased response times if overloaded.

Response Time Thresholds

Based on our discussion and inputs from Ian, we decided to update the response time thresholds for the GitHub Action simulations as follows:

  • Green: Less than 200ms
  • Yellow: Between 200-1000ms
  • Orange: More than 1000ms

These changes will be implemented in the next iteration.

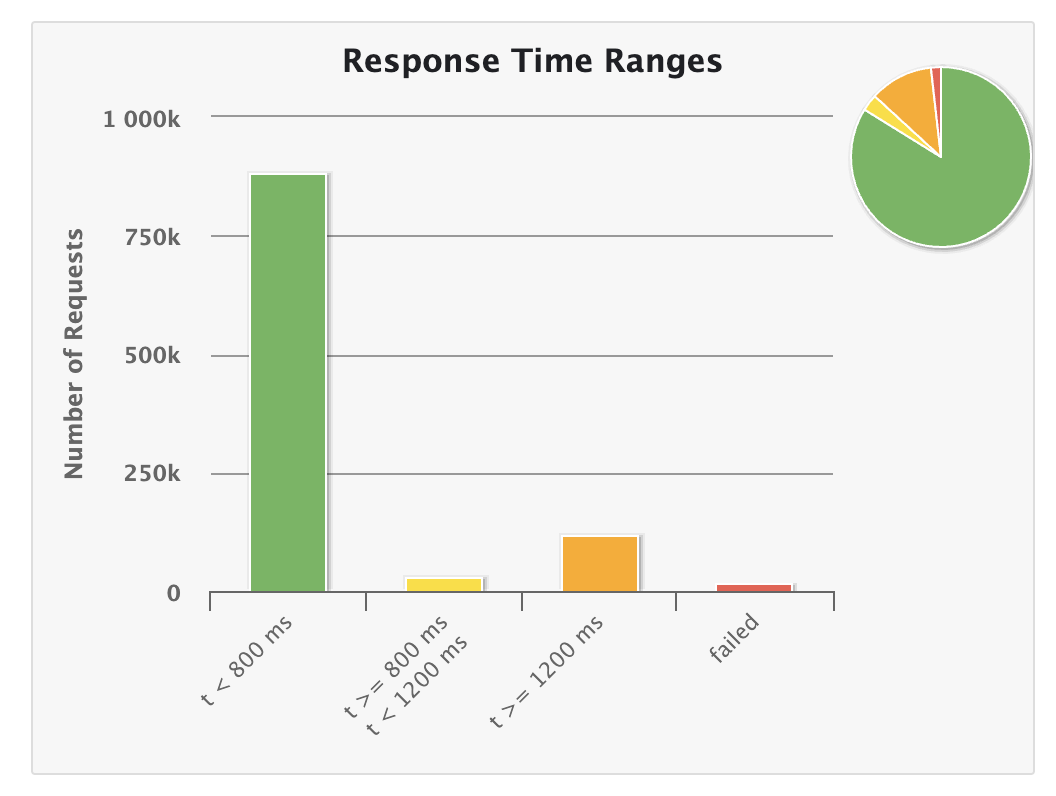
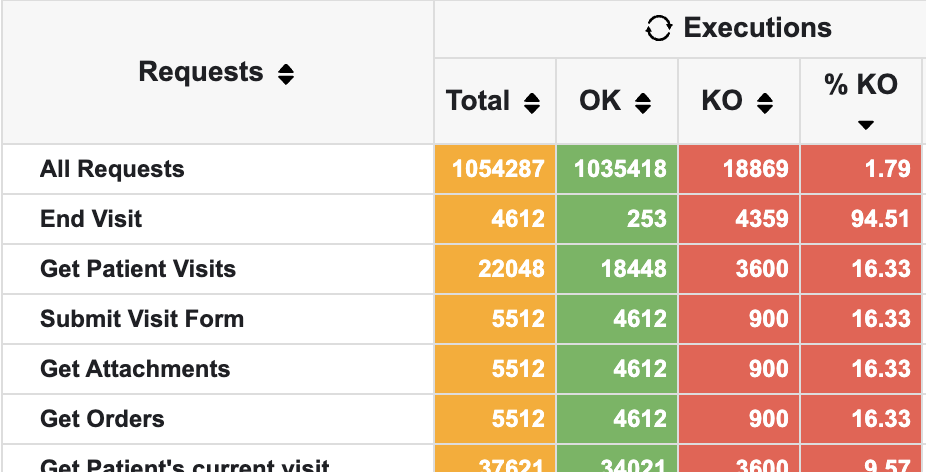
This is how it currently shows;

KO Count Analysis

We discussed the KO count (Knockout or opposite of OK). Currently, 1.79% of requests are KO. However, it seems most of these failures are due to local issues or invalid submissions rather than server issues. This requires further investigation and fixes.
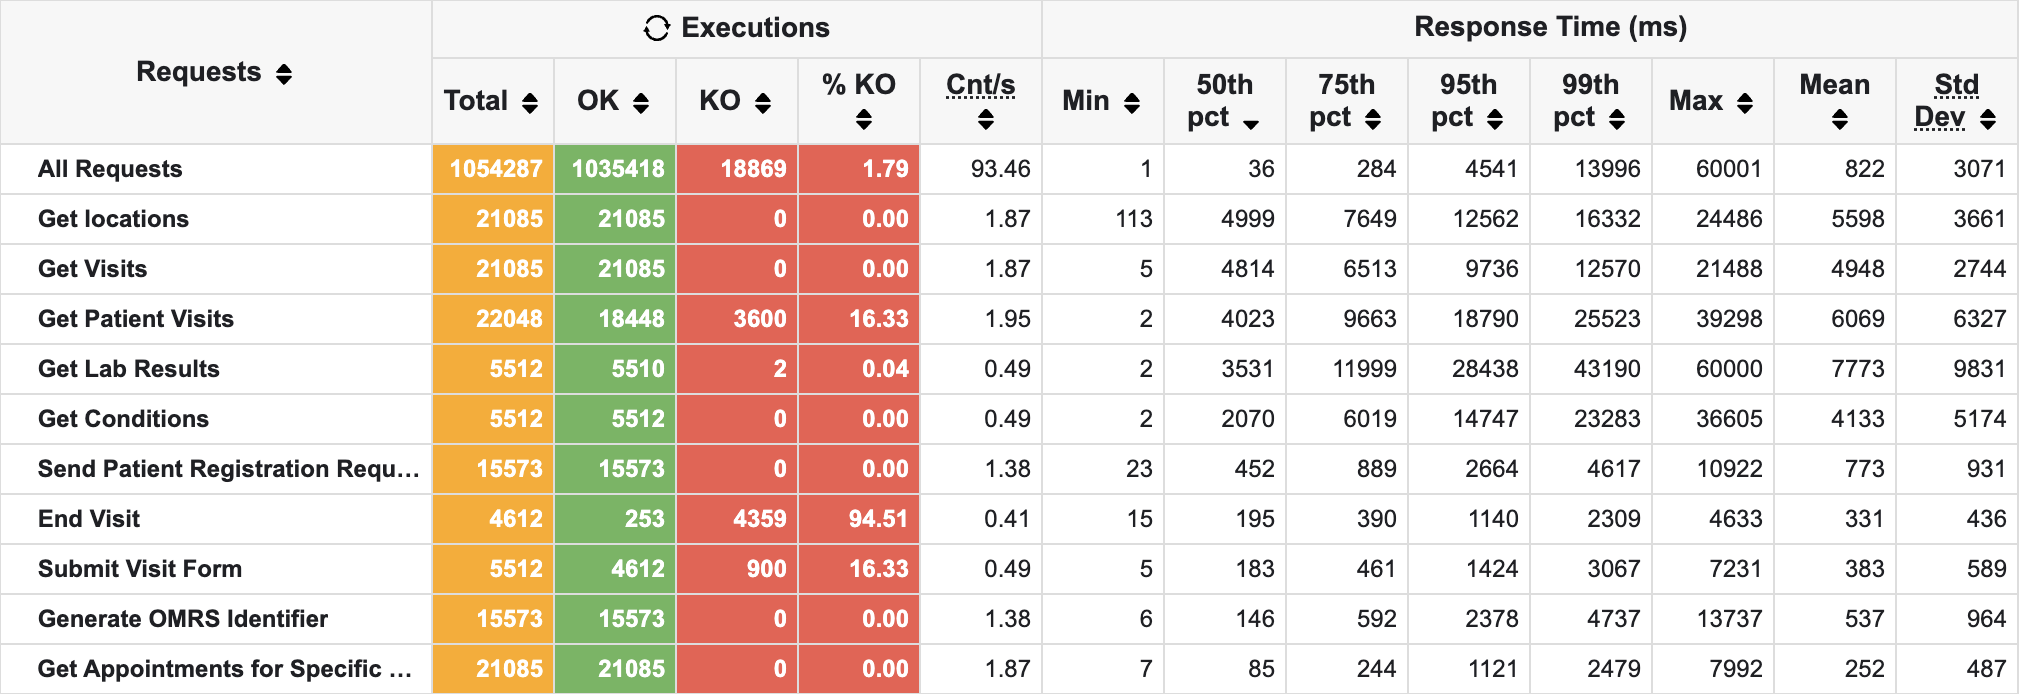
Slowest Endpoints

We also reviewed the slowest endpoints. Here’s a screenshot of the top 10 slowest endpoints:

Location API

Currently, we use the FHIR API to get locations. This API has to make iterative database queries, causing it to be relatively slow. Previously the suggested change was to change to the rest API. But @burke pointed out that switching back to the REST API is just a short-term fix, we should focus on improving the FHIR API to allow more selective data requests. This aligns better with our long-term goal of using the FHIR API extensively and reducing reliance on custom REST API calls.

@ibacher @dkayiwa , please share your thoughts on how to move forward with this endpoint.

Immediate Next Steps

  • Me: Investigate and fix the root causes for KOs to ensure accurate tuning and avoid false positives.
  • @dkayiwa : Review the report to identify slower endpoints, such as “Get Visits,” (for location, not the visits of a patient) and figure out how to reduce response times. Run tests locally if needed while improving endpoints. I will assist with setting up, running simulations, or updating scenarios as necessary.

cc: @grace @paul @janflowers .

1 Like

Thanks @jayasanka for continuing to look into this. When you talk of the top 10 slowest endpoints, which column are you using to determine that? Is it the 50th pct column? Secondly, how can i get from the report to the actual end point url that is used for a request?

1 Like

how can i get from the report to the actual end point url that is used for a request?

See here: openmrs-contrib-performance-test/src/test/java/org/openmrs/performance/http at main · openmrs/openmrs-contrib-performance-test · GitHub. Code in that package has the requests and labels used.

When you talk of the top 10 slowest endpoints, which column are you using to determine that? Is it the 50th pct column?

Yeah, 50th percentile (median response time) seems like the right thing to be looking at.

2 Likes

Thanks @ibacher :slight_smile:

And how many users do the slowest endpoints represent? Just one? or 200?

It’s the median over the whole run, so up to 200 simultaneous requests. But you can see how many individual requests are made to each endpoint from the “Total number”… and if you click on each request name it will take you to a detailed page (example) about that endpoint. Note, though, that the number of requests varies by workflows and we have two different templates, so requests defined in HttpService are made by all users and those in the ClerkHttpService and DoctorHttpService are made by half the number of currently active users.

Would i be correct to say that this is a report to investigate issues with performance due to many concurrent users trying to use the system? In other words, different from those cases we were looking at where we had performance concerns for even one user?

It’s likely that there are issues that come from concurrent load that don’t happen for single-user cases, but it seems unlikely that there are things that are slow for a single user that are not also slow with multiple users. Or, to put it another way, the requests that perform badly under load also appear to be the requests that take the most time in general, so fixing one should fix the other.

But this does raise an interesting point. @jayasanka How hard would it be to spin out another report that just has a single user hammering away at tasks for 30 minutes? It might be a useful benchmark.

2 Likes

It is very possible. I’ll create a new github workflow with following environment variables: TIER_COUNT = 1
TIER_DURATION_MINUTES = 30
USER_INCREMENT_PER_TIER = 2 (for two personas)

1 Like

I made a new GitHub action to generate a different report. It runs daily, you can manually trigger it as well.

By the way, do you think it’s worth adding an extra tier with a single user in the main simulation?

cc: @dkayiwa

1 Like

If it takes a significant amount of your time, i can just use the chrome dev tools. :slight_smile:

1 Like

@dkayiwa You can download the single user simulation report here as an artifact: Run Performance Tests on Single User · Workflow runs · openmrs/openmrs-contrib-performance-test · GitHub

1 Like

I get this report for a single user.

1 Like

@dkayiwa did you come across any intriguing findings?

1 Like

I don’t really think we need to add a 1 user tier to that. I think having a separate report actually gives us a lot more insight than a single combined report would.

1 Like

It is interesting to see in the single user report that the order of the low performing requests changes.

1 Like