OpenMRS Load Testing Strategy

Load testing is a type of performance testing used to examine how a system behaves under significant loads, typically simulating real-world use cases where multiple users access the system simultaneously. The objective is to identify performance bottlenecks and ensure that the software can handle high traffic without compromising functionality or speed.

By examining the testing methodologies of similar systems like Bahmni and assessing various testing tools, the aim is to establish a sustainable and effective testing protocol.

Here’s a summary of findings for OpenMRS load testing, incorporating input from Ian:

A similar setup to OpenMRS is Bahmni, which has its performance tests available here. Bahmni’s strategy involves replaying a series of API calls for two different scenarios: a clinician and a registration clerk. They use Gatling and run on AWS.

For a start, I thought of using three personas: doctor, nurse, and clerk, based on information from this document.

Full Stack vs Backend-Only Testing

A key decision is whether to conduct the load tests on the full stack (UI + backend) or focus solely on the backend:

UI Testing:

  • Pros: Reflects users’ experiences more accurately.
  • Cons: Requires a web browser, consumes substantial resources, and necessitates more servers for client-layer tests. Frameworks like Selenium and Playwright that drive UI tests are also resource-intensive.

Backend Testing:

  • Pros: Simulates a set of API calls based on specific scenarios, providing an efficient way to test backend performance.
  • Cons: May not mirror actual workflows accurately. For instance, logging into O3 RefApp involves three calls to the session endpoint, while an API test might simplify this to one call, neglecting important details. Therefore we have to pay extra attention to use all API calls used in the UI.

Given available resources, backend testing seem the most viable solution, led by the platform team, with input from the O3 team to ensure accurate workflows.

Tooling

  • JMeter:
    • Scripting: Most of the work is done by the GUI. Version control can be challenging, as test plans are often saved as XML files.
    • Reporting: Generates detailed reports with a variety of metrics, including response time and error rates. Reports can also be extended with plugins.
    • Performance: Can handle a moderate number of concurrent users, but tends to be memory-intensive, especially for larger tests.
    • Complexity: extremely complicated to set up, configure, and extract reports from compared to other options. Its GUI can be daunting for new users.
  • Gatling:
    • Scripting: Can be used with Java for scripting which the community is familiar with (originally it was Scala, but now supports Java as well). Supports version control well, as scripts are text-based and can be managed with Git.
    • Reporting: Generates detailed HTML reports with various metrics.
    • Performance: Efficient and capable of handling many users with low resource consumption. Designed to support high concurrency.
    • Complexity: Very low compared to JMeter. It should be easier because the community (and the platform team) is familiar with Java. Easy to integrate into CI/CD pipelines.
  • K6:
    • Scripting: Uses JavaScript for scripting, making it accessible for many web developers. Supports version control effectively, as scripts are text-based and can be managed with Git.
    • Reporting: Generates detailed HTML reports with various metrics. Can be integrated with monitoring tools like Grafana for detailed reports as well.
    • Performance: Highly efficient and designed to handle high user loads with low resource consumption.
    • Complexity: Very low compared to JMeter. Should be easier because the community is familiar with Javascript. Easy to integrate into CI/CD pipelines.
  • Locust:
    • Scripting: Uses Python for scripting, making it accessible for Python developers. Scripts can be managed with Git.
    • Performance: Designed to support distributed load testing, allowing it to handle high loads. Its performance depends on the implementation and system configuration.
    • Reporting: Offers basic reporting. Can be integrated with monitoring tools like Prometheus and Grafana for detailed insights.
    • Complexity: Very low compared to JMeter. However, the community is less familiar with Python. Easy to integrate into CI/CD pipelines.

Given its low complexity, version control compatibility, and use of languages familiar to the OpenMRS community, Gatling stands out as a suitable choice.

Personas

  1. Clerk
  2. Nurse
  3. Doctor

Clerk

Scenario 1:

  • Morning Routine:
    • Login
    • Review calendar
    • Check appointments
  • Patient Registration
    • Load metadata
    • Generate openmrs id
    • Submit
  • Existing patient check-in
  • Service Queue Management
  • Appointment management

Nurse

Scenario 1:

  • Login
  • Go to the home page
    • Load active visits
  • Open a patient from active visits table
    • Load patient details
    • Load summaries
      • Vitals, biometrics, conditions, medications
  • Record new information
    • Vitals & biometrics
    • Immunizations
    • Lab Results
    • Allergies

Doctor

Scenario 1:

  • Login
  • Go to the home page
    • List all visits
  • Open the patient chart
    • Load summaries
  • Review Medical History
    • Vitals & biometrics
    • Visit history
    • Lab Results
    • Conditions
    • Allergies
  • Record new information
    • Notes
    • Attachments
    • Lab order
    • Medication
    • Allergies
    • Forms → SOAP (Simple) || OPD (complex)

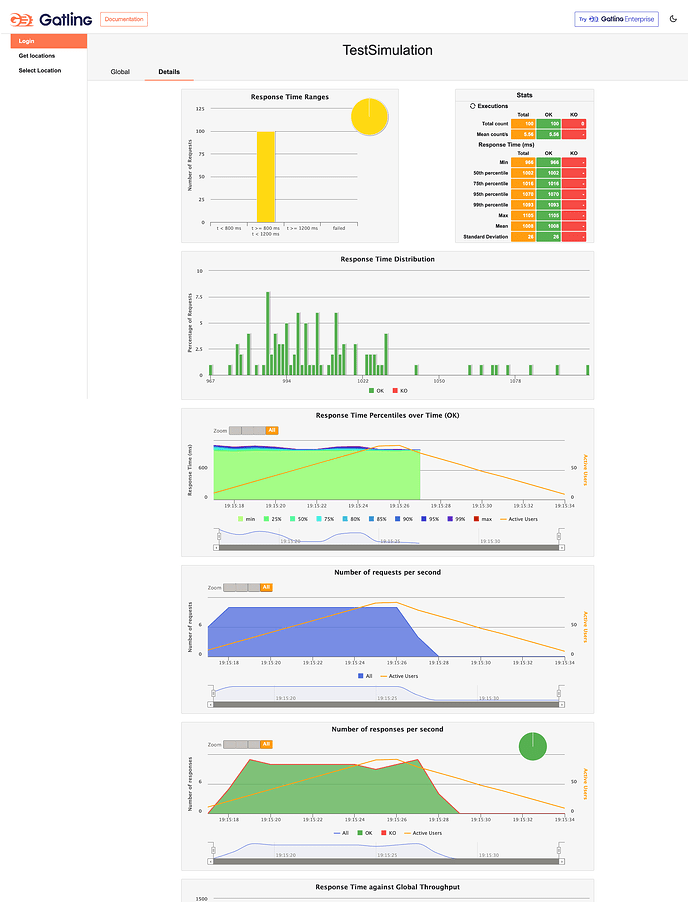
I started a project using Gatling and here’s what the report looks like. This is a small test involving the OpenMRS login, run against dev3.

7 Likes

@jayasanka I think we need to incorporate in testing customisable assertions for performance metrics so that we can have CI build failures if we discover performance degradation.

Gatling has the needed feature, but it needs to be implemented in a way to be able to adjust these with some global setting when running on different hardware and with different load scenarios, e.g. have some configurable multiplier in the equation for max response time.

Ideally, the solution would allow us to compare results from previous runs and highlight degradation. I saw it being advertised for Gatling Enterprise, but not sure there’s something available for the open-source version.

I like that Bahmni has presets for different load scenarios and a way to customize them further.

Anyway it’s great that this is moving forward and the sooner we have something even basic in place the better. We can iterate over the setup. It’s been long awaited for OpenMRS to have such tests and run them at least as part of the release process.

2 Likes

Thanks for the suggestion, @raff. I’ll try to implement that.

Meanwhile, I moved the project to a new repository: GitHub - openmrs/openmrs-contrib-performance-test

I created a GitHub Action to spin up a server within the action and run simulations. So far, it’s handling 200 concurrent users for approximately 80 seconds, continuously registering patients. The flow involves a clerk visiting the login page, registering and selecting a location, going to the home page, opening the registration page, registering the patient, and navigating to the registered patient’s chart page.

You can view the latest report from here:

:jack_o_lantern: Report - Click me!!! :space_invader:

Note: Ignore failing API calls, I need to fix them.

You can also download the report from the artifacts section of the action.

It seems we can go beyond 200 concurrent users on the GitHub Actions agent, but after experimenting with different numbers, 200 appears to be the sweet spot. I’ll try to implement multiple thresholds similar to Bahmni.

Here’s Bahmni’s traffic configuration:

Load Type Concurrent Users Duration Initial Ramp Duration
STANDARD 40 1 hour 60 seconds
HIGH 50 1 hour 60 seconds
PEAK 70 1 hour 60 seconds
dev env variable env variable 10% of Duration

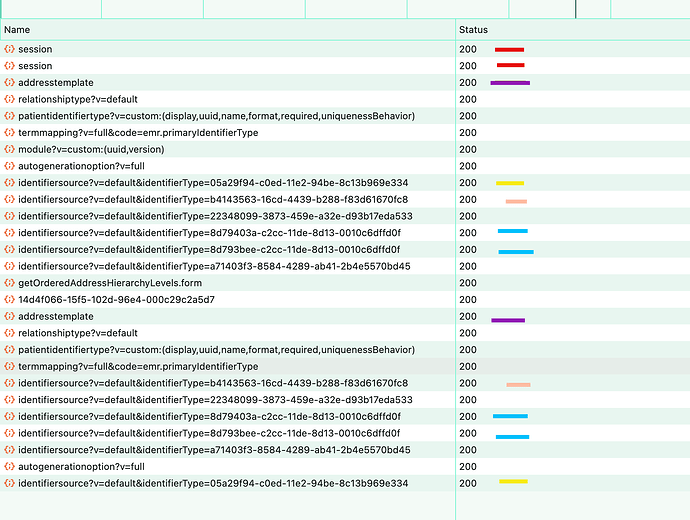
Meanwhile, I noticed that the UI calls the same endpoint multiple times. @vasharma05 , @dkigen, @ian, @samuel34 do you have any idea why this is happening?

ex: Registration page (I marked some of the repeating calls with the same color)

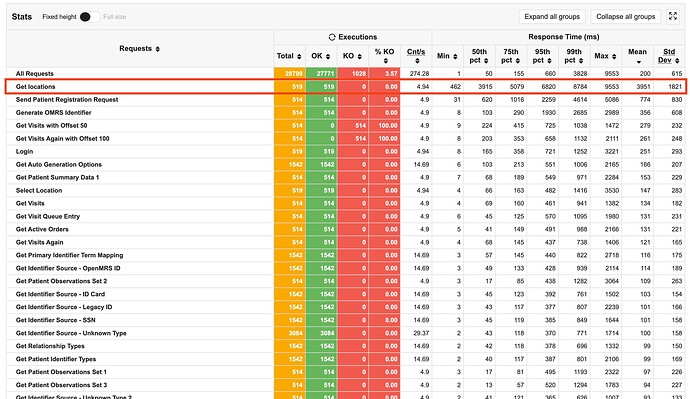
@dkayiwa, based on the simulations run so far, the “get locations” call is the slowest endpoint with an average response time of approximately 3951ms. At the same time, 64% of other endpoints have less than 50ms response time.

/openmrs/ws/fhir2/R4/Location?_summary=data&_count=50&_tag=Login+Location

cc: @janflowers @grace @caseynth2

3 Likes

Very interesting findings already, Jayasanka!! I’m happily surprised by how quickly this testing is yielding results. These are especially interesting to me:

Looking forward to hearing from folks on why these are happening & what we can do about it :smiley:

I’m a little confused about what we’re looking at there, that is, I’ve never come across a scenario that duplicates the calls to autogenerationoption, identifiersource, relationshiptype without a page reload of some sort, but I would’ve expected to see the other calls duplicated in that scenario…

Simplest thing with Get Locations is probably to switch to using the REST API instead of the FHIR API. I think @dkayiwa has recommended that a few times.

2 Likes

Question for @aojwang, @slubwama, @frederic.deniger, and @moshon: What is the max number of concurrent users you would want OpenMRS to be able to handle? 100? 500? 1,000? 10,000? Etc…

the max concurrents users is around 100 no more ( and could be 50).

1 Like

@grace, thanks. In the HIV clinics, we have always had below 100 users and it all depends on the size of a facility. We expect this to change with the transition to cover all service points in the facility.

1 Like

@grace 100-150 could be a good strarting point.

1 Like

Thanks for your inputs, @frederic.deniger, @aojwang, and @slubwama.

If we categorize the number of users into the following threshold levels, do these numbers make sense?

  • Standard: 30
  • High: 80
  • Peak: 150
1 Like

@jayasanka - using tablets to access the EMR has made it so easy to add service points in a facility. The numbers are good but we can aim to support even more than 150.

1 Like

Awesome! We can set 200 as the peak and 100 as the high. Do you think 30 would still be reasonable for the standard threshold?

30 is still good. We will be sharing updates as we expand.

1 Like

Thanks a lot, Antony! :heart:

Hey everyone,

Update: We’re now running tests with demo patient data!

Why the change?

Systems like Bahmni generated empty patients with zero observations for each test run. But for accurate load testing, we need a rich, realistic data environment.

How Did You Do It?

So, how did we make this happen? We considered three options:

  1. Create patients within the scenario.
  2. Create patients using the API before running tests.
  3. Leverage demo data generation.

Option 3 was the winner! It helps generate patients with realistic data. Here’s the scoop:

  1. Spun up an instance and set the value of referencedemodata.createDemoPatientsOnNextStartup to 300 to start. This is a time-consuming task.
  2. Wrote a script to export patient UUIDs to a CSV file.
  3. Used the CSV file to feed patient IDs into the simulation.
  4. Preserved the database as a dump file.

When running tests on GitHub actions, the dump file loads first, making patient data generation a one-time task.

What’s the Current Status?

Curious about the current status? Here’s the lowdown:

  • The simulation runs with 200 concurrent users (100 doctors + 100 clerks).

  • Tests currently run for around 2 minutes. I’ll extend this period soon.

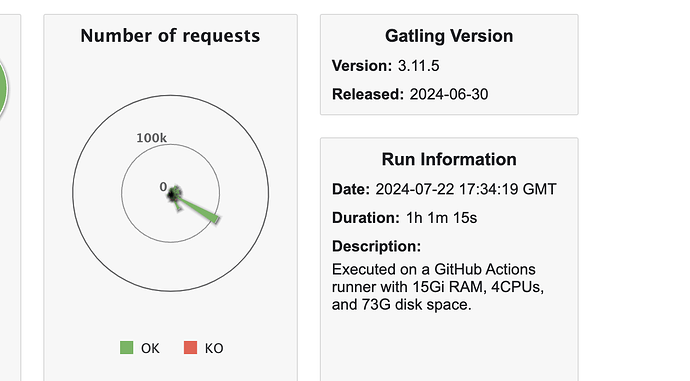
  • Tests are running on standard GitHub hosted runners with 4 CPUs, 16GB RAM, and 14GB SSD. This is less than the O3 minimum hardware requirements, which is a good sign.

  • New addition - Doctor persona: Each doctor performs the following

    1. Login
    2. Open Home Page
    3. Open Patient Chart Page
    4. Start Visit
    5. Review Vitals and Biometrics
    6. Review Medications
    7. Review Orders
    8. Review Allergies
    9. Review Conditions
    10. Review Attachments
    11. End Visit

    The feeder runs chronologically and repeats patients once the list is finished.

How can I help?

  • Check out a recent report and give me feedback! Click me!!! :cat:
  • Review the source code and let me know your thoughts. @ibacher, thanks for your comments!
  • If you’re involved in performance improvements, use these reports as a reference. You can identify slow-performing endpoints in the “stats” table. These tests run daily, and you can download the latest reports here: GitHub actions.

What’s next?

So, what’s next? I’ll post an update on our decision regarding concurrent users soon. Other tasks are:

  • Add more activities to the doctor persona, especially data entry tasks.
  • Introduce load scenarios and make them configurable.
  • Introduce CI build failures based on assertions for performance metrics.
  • Publish the latest report as a link to ensure easy access. Ideally, host the report on a static server such as GitHub Pages.

Thanks!

cc: @grace @dkayiwa @raff @janflowers @burke

1 Like

The approach of using personas and focusing on backend testing seems promising. - just a question regarding the UI calls: Given that some endpoints, like the “get locations” call, show significantly higher response times, have you considered implementing caching mechanisms at the client or server level to reduce the load and improve performance? Also, any idea how do we plan to address the issue of repeated calls to the same endpoints?

1 Like

Thanks, @oliebolz, for your response.

Regarding the Get Location API call, it’s suggested that we switch from using the FHIR API to the REST API to fetch loactions. @dkayiwa, could you provide more details on this?

For the repeated call issue, @dkigen will investigate it next week. You can check the status here: O3-3449.

2 Likes

This API is already in place. It is a matter of switching to it.

2 Likes

I wanted to provide an update on our decision for the number of concurrent users. We reached out to various implementors to gather input on the maximum number of concurrent users they expect. The feedback we received indicates that most implementations expect between 100 to 150 concurrent users. However, one implementor mentioned plans to support up to 3,500 concurrent users in the future.

We had a detailed discussion during our last platform team call, and we reached a consensus to focus our current testing efforts on supporting 100 to 150 concurrent users, with a practical upper limit of 200 concurrent users. Here are the reasons behind this decision:

  1. Realistic Expectations: The majority of our current implementations fall within the 100 to 150 concurrent user range. This aligns with typical usage patterns and ensures that we are meeting the needs of most implementors effectively.
  2. Misunderstanding of Concurrent Users: The mention of 3,500 concurrent users likely resulted from a misunderstanding of the term “concurrent users” versus “total users.” Concurrent users refer to those actively using the system at the same time. Supporting 3,500 concurrent users would imply having a total user base of approximately 17,500 to 35,000 users, which reflects a very large, potentially country-wide implementation. This scale of use is far beyond typical current scenarios and would require substantial infrastructure and resources.
  3. Scalability and Infrastructure: Supporting a much larger number of concurrent users, such as 3,500, would require significant architectural changes, including multi-instance deployments and advanced load balancing strategies. These are beyond the scope of our current infrastructure and would necessitate further planning and resources.
  4. Performance Optimization: By focusing on the 100 to 150 concurrent user range, we can ensure that the system performs optimally for the majority of our users. This also allows us to identify and address any performance bottlenecks more effectively within this more manageable range.
  5. Future Planning: While we are not currently aiming to support 3,500 concurrent users, we acknowledge that scalability improvements will be necessary for larger implementations in the future. We can explore these enhancements as part of our long-term roadmap.

By sticking to the 100 to 150 concurrent user limit (and using 200 as a practical upper limit for testing), we can provide reliable performance and scalability for our current implementations while planning for future scalability needs.

If there are any further questions or concerns, please feel free to reach out.

3 Likes

You can find the latest load test report here, updated daily: o3-performance.openmrs.org

@burke I’ve included runner information on the report as you requested:

2 Likes