According to the Mora Metadata Management in AdminUI project, I have implemented Manage Module, System Information, and Manage Scheduler functionalities through the System Administration open web app and those features were included with the Reference Application 2.8 release.
So now, I would like to extend the features of the System Administration OWA. So I have started working on bringing the Server Log feature to the System Administration OWA.
Following images will illustrate the implementation,
Could I get some feedback about this one from the community?
AFAI this feature would be helpful to the Cloud or Server-based OpenMRS implementations, and they don’t need to swipe between dashboards and backend terminals to get the logs.
If you want to do something really cool with this, you’d add some sort of filtering that only displays/highlights errors in the logs, and a one-click way to do something useful. (Download just that part? Email them somewhere? Post to Talk?)
Ideally this would happen on the server-side, and the OWA would only expose the UI for it.
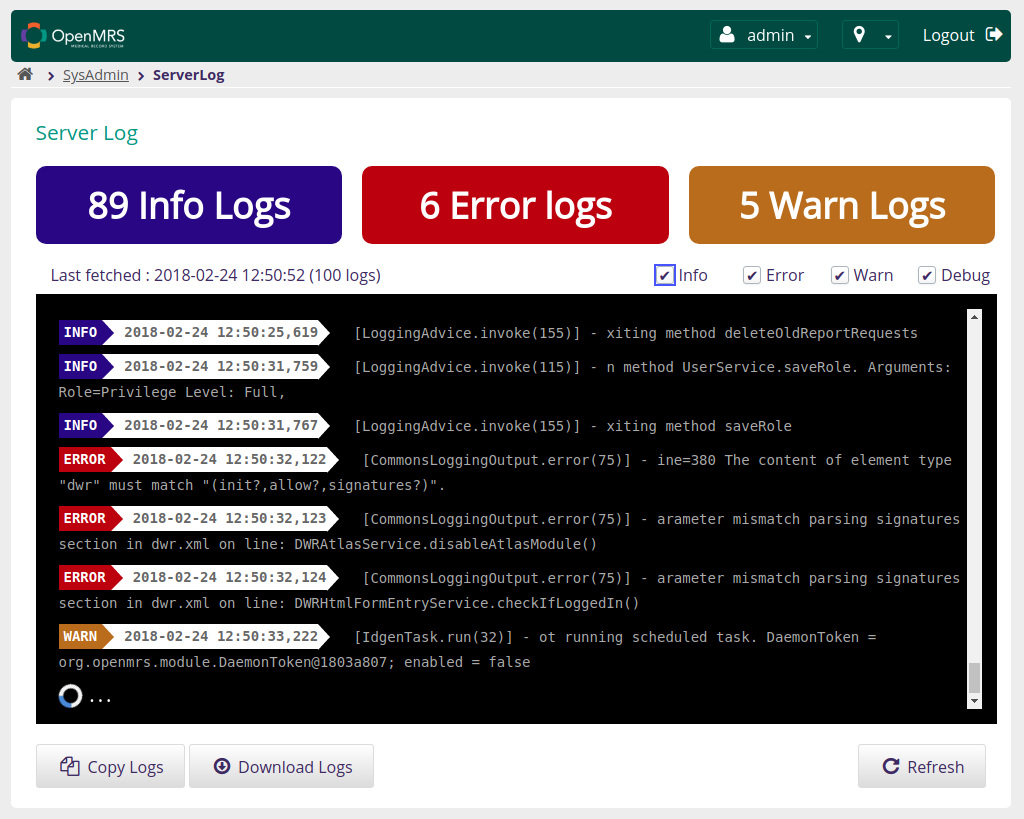
I have completed some part of this implementation by now. This is the Server Log page in the SysAdmin OWA. I will continue the work to improve as @darius suggested.
Logs will be categorized as Info, Errors, Warnings, and Debug
The user can select the type to get only those type of logs in the terminal
The user can copy or download the logs which are displayed in the terminal.
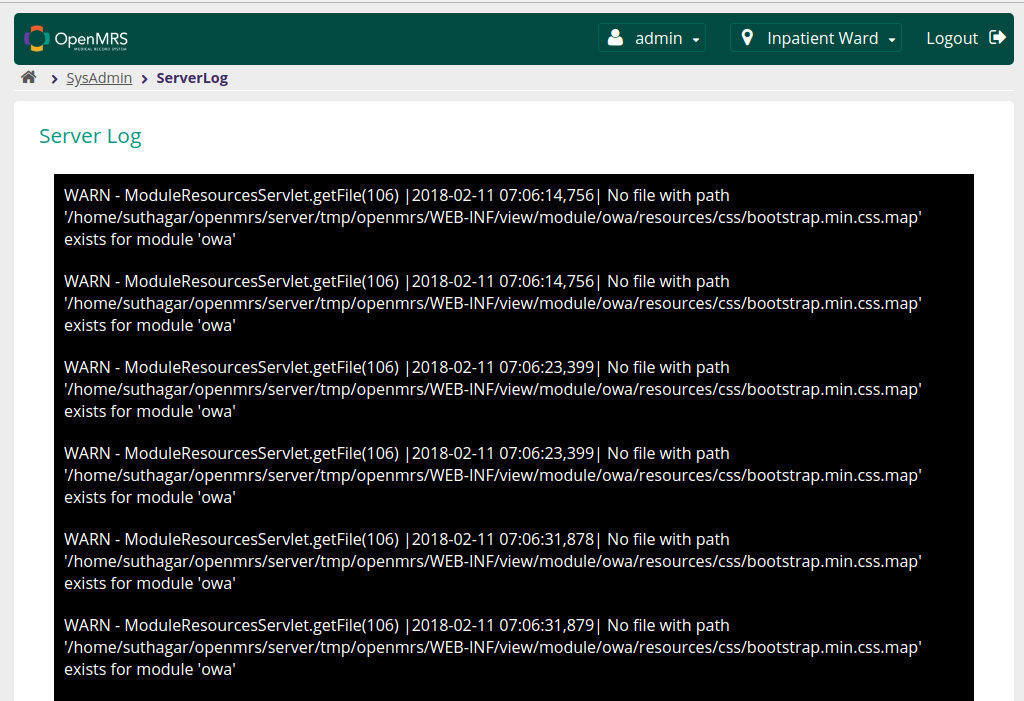
Just looking at this screenshot, it’s a bit hard to read the actual text, and there’s too much emphasis on the timestamp. Also it looks like you’re losing the first character after the - on every line.
Stepping back, the real use case here typically involves having lots of logs (many thousands of lines) and you need to find the right thing.
So it would be really cool to have some kind of timeline/slider that lets you quickly jump in time through the logs. Even better if this has some kind of tick mark for every error.) A date/time picker could also work, but offhand I expect a slider is better UX.
I could also imagine buttons for “jump to next/previous error”.
Or, a full-text search. (That said, we shouldn’t go overboard here; the real long-term solution should be to load this data into ELK or similar, not rebuild everything in the OWA.)
Just looking at this screenshot, it’s a bit hard to read the actual text, and there’s too much emphasis on the timestamp. Also it looks like you’re losing the first character after the - on every line.
I fixed this one, It happened due to some RegEx mistakes to extract the information from the logline while testing. Is it better to change the view of this log terminal to display the log lines clearly? (Anyway we need the type of error, time stamp, appender and log information here)
Stepping back, the real use case here typically involves having lots of logs (many thousands of lines) and you need to find the right thing.
I thought to have two ideas for this one,
Log viewer for showing live logs - It can be done using the Memory Appender(mostly It will return the last 100 lines of logs to the OWA). Then It will automatically add the new logs to the bottom of the log terminal.
Log Viewer for complete usage - Here we need to deal with the Logs file to show and retrieve the past logs.
Currently, I have only developed the Log Viewer for live logs (using memory appender), anyway, It can be extended to further log access using the log files.
So it would be really cool to have some kind of timeline/slider that lets you quickly jump in time through the logs. Even better if this has some kind of tick mark for every error.) A date/time picker could also work, but offhand I expect a slider is better UX.
What I thought is,
When the user moves the cursor to the top (last log), It will make another REST call and fetch the latest 100 logs before that last log. And It will be added to that last log. So User can simply scroll the terminal to get the previous log is one way.
There will be a two-date selection box (Start date and end date) to get the logs between that date frame(Max 30days). Then only we can end up with the quick response within the selected date frame. Otherwise, we need to deal with the whole log files to fetch the required data.
Other than this, I planned to implement a Search for logs function, but It should enable with start and end date for the log selection(Max 30days).
I could also imagine buttons for “jump to next/previous error”.
I couldn’t understand the usage of this. Here the terminal will be displayed one or more logs or errors, So why we need this buttons?
a user reported a bug. this happened hours/days ago, but I know approximately when it was
I want to see if there are errors being reported by my system that I’m not aware of
(I should say that I’m not an actual OpenMRS sysadmin, so my word is not gold.)
So, it would be nice to be able to:
jump to the beginning of the logs (and/or the last system startup if the logs aren’t reset on server restart)
jump to a specific time
filter to only see error-level logs
jump back in time from “now”, or forward in time from server startup, to the first/last error-level log.
Slider was just a suggestion that could cover 1 & 2, but there are other ways.
That said, once you start reading log files from disk, it probably makes more sense to spend our effort in documenting/automating an easy way to load everything into a real log analysis tool, rather than writing custom code for what is a solved problem. (For example a docker image that takes an ELK stack, expects to find the openmrs logs folder mapped in as a volume, and automatically loads that data and configures some custom views.)
That said, once you start reading log files from disk, it probably makes more sense to spend our effort in documenting/automating an easy way to load everything into a real log analysis tool, rather than writing custom code for what is a solved problem. (For example a docker image that takes an ELK stack, expects to find the openmrs logs folder mapped in as a volume, and automatically loads that data and configures some custom views.)
It’s true!.
Here I intend to use the Memory appender to fetch the last logs from the CircularFifoBuffer (buffer size =100). So when the user opens the Log viewer it will only fetch the last 100 logs from CircularFifoBuffer. When there are any new logs, It will automatically be added to CircularFifoBuffer and it will remove the oldest element (We are not removing from the terminal view).
If we want to fetch the logs from server startup, then I need to access the openmrs.log file which was logged by RollingFileAppender. Other than that how can I fetch the logs from startup?
If I load the log file, then there are some RegEx matching and conversion tasks to find the logs by date and time. So here we need some much effort and need to keep the whole logs in the memory for the process. Do Have you any idea to overcome this?
If there are any speedup ways, then I can work on those log filter features based on the DateTime.
Other some cool features,
It would be good to create a Pastebin item with a single click from this page (public bin). I tested this feature and worked perfectly. System will provide the URL for created paste item in the Pastebin
Users can download the whole logs or selected lines in multiple formats for their further usage (Text, JSON, XML, CSV)
Users can filter the logs by all levels (info, error, warn and debug)
Users can select the log lines using checkboxes (So they can select some lines from the whole terminal, and copy them or create the Pastebin item quickly)
After some interesting research about the ELK stack and Logstash (wonder log analysis tools) , I feel if we are moving to separate module for Log Management using those log analysis tool - It would be awesome and free to implement more analytics there. ( I think, there was a module called Log Manager and It does not support to the current OpenMRS versions)
I have two ideas right now to make this process easy for now,
I feel better to use the existing core functions and some REST functions to provide a Live Log Viewer feature (not a whole log analysis tool for now) to the users?
They can use it through the open web app (SysAdmin) and can make their live log analysis easily.
Implement a MemoryErrorAppender with the buffer size of 100 - 500 (Like MemoryAppender with buffer size 100). So The MemoryErrorAppender will keep only the errors in the CircularFifoBuffer to serve the requests. Then we can move between the errors quickly and apply the regular expressions easily. - It needs a change in OpenMRS Core.
It will use the MemoryAppender INFO, WARN, DEBUG level logs and use MemoryErrorAppender for ERROR level logs (we need more space for the error analytics).
Live Log Viewer will help the users to manage their log analytics from x (x=buffer size of MemoryAppender) log lines before the current state and, It will continuously display the log lines until the user closes the Open Web App terminal (we will not replace the log lines in the OWA terminal).
we can provide a feature to increase the buffer size of the Memory appender through the OWA (but there should be an upper limit) to get some more logs before the current state.
I agree that it’s best to keep our focus here a bit smaller, and do the larger solution in some other log analysis microservice.
I agree about limiting to just the live log viewer feature.
I like the idea of keeping a larger log of only errors. Is it possible to also have a new startup log which stores only the first N lines and then stops?
I like the idea of keeping a larger log of only errors. Is it possible to also have a new startup log which stores only the first N lines and then stops?
Yes, We can use the apache.commons.BoundedFifoBuffer instead of CircularFifoBuffer. So the only difference is that BoundedFifoBuffer throws an exception when it’s full and you try to add new element while CircularFifoBuffer removes the oldest element.
For this, I need to make some changes in the MemoryAppender Class. I need to initialize the BoundedFifoBuffer with some buffer sizes and logic. The error logs will be added to BoundedFifoBuffer when append() method triggered by log4j itself.
Apart from this, I need to create some logic to implement the Pastebin paste creation through the server. I can’t call PasteBin backend APIs through OWA Rest calls because of the access Origin problems. Which is the best place to implement the Pastebin API trigger methods?
I would prefer not to automate creation of a pastebin, but instead we can just automate “copy to clipboard” and let the user decide what to do with it.
My reasons are:
it’s possible that the log file contains sensitive information (patient and/or server details), and I’d like it to be a more conscious choice of an admin to post it publicly on the internet.
While we do use pastebin a lot in the OpenMRS community, and people generally recommend it on Talk, there are alternatives (e.g. I tend to prefer github gist), and I wouldn’t want to build knowledge of pastebin into the OpenMRS platform.
(I admit that my counterproposal requires an extra step, but I’m fine with that.)
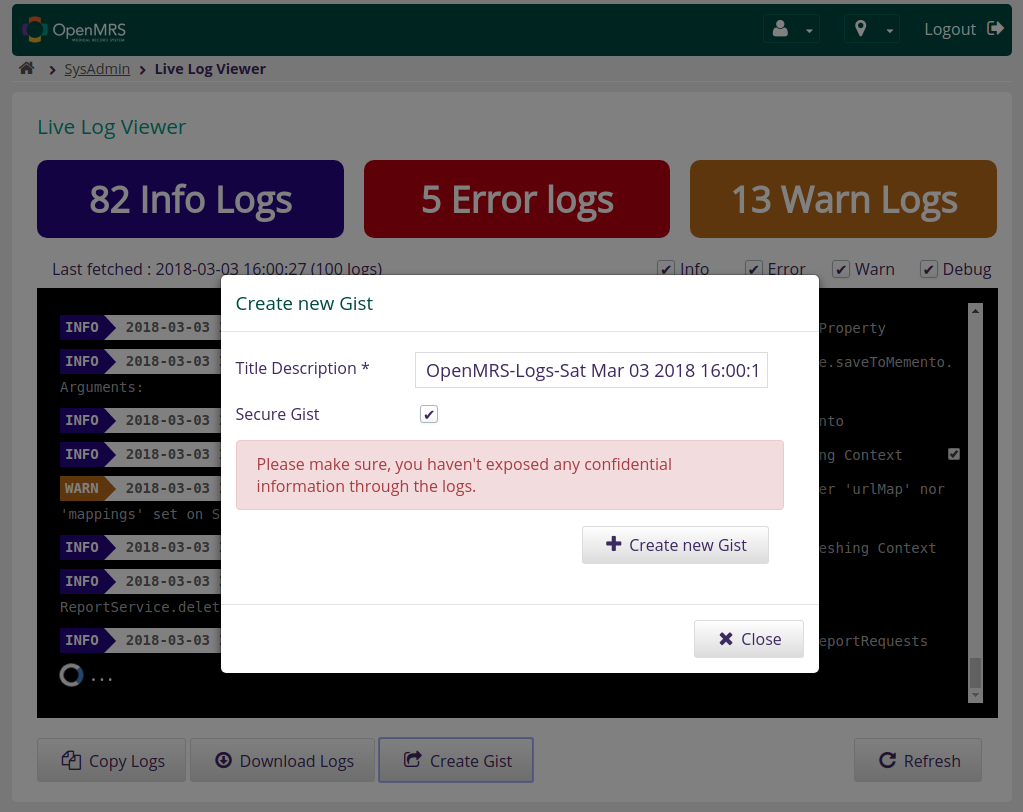
As your suggestions, I have simply implemented the export feature to GitHub Gist. The user can create a Log Gist with the public or secure condition and they can share the link with others.
I have discussed the privilege check implementation thorugh this following talk thread. Please use it to get more information about the REST Previlege check.
@darius, I have updated the PR with the privilege check implementation. Can you please take a look at here[1]


 . I hope to attach those features as well.