here is where we are with a proposed outline for the annual report. Please feel free to contribute directly in the google doc. we still have a ways to go!! thanks.
https://docs.google.com/document/d/1Qbz0dJJFLVkWLAmrE8L8MuW9tB4ezT7N9UYg9ePUzXY/pub
here is where we are with a proposed outline for the annual report. Please feel free to contribute directly in the google doc. we still have a ways to go!! thanks.
https://docs.google.com/document/d/1Qbz0dJJFLVkWLAmrE8L8MuW9tB4ezT7N9UYg9ePUzXY/pub
I think this looks good.
Maybe broad catagories corresponding to:
Who are we? what is OpenMRS mission and vision community leadership Why do we matter? human interest story/highlight What have we done? goals for 2015 accomplishments (all that you’ve included) Where are we going? goals for 2016 How can you join us? community roles opportunities to engage with the community
all the indentation got lost - but my point was to put things under the questions, at least conceptually. I’d carry those conceptual divisions thorough to visual design differences between these major sections, though - I think framing at this level is useful
i like this–it helps answer the question of why this is important. terry
adding some updates to the annual report outline check it out and comment! thanks. terry
updated the outline a little and gave some ideas about who should do what. If you are interested in helping put this together in the next 4-6 weeks, please let @jan and/or @terry know. thanks.
Hi @terry @janflowers, as a follow up task from the summit, I created a GCI task for students to design a good annual report template for us. Ticket details can be found at https://issues.openmrs.org/browse/GCI-125
I have a bit of time this week and I’d like to calculate some simple (simplistic) stats about dev engagement in 2015.
Ideas welcome for what numbers to look at!
My initial idea is to look at the number of github users who contributed commits to OpenMRS in 2013, 2014, and 2015. I plan to look at
I also plan to look at people who moved categories (no commits, 1-9 commits, 10-49 commits, 50+ commits) between 2014 and 2015, and report on the numbers who increased vs decreased their participation.
Feedback on this?
Darius, sounds great. Any way to also strategy based on gender/ country? would help us with our diversity stats also. and,we would love to use this in the annual report if that is OK.
would it be of interest to see how the dev stage affects anything? and, what about when people move dev stages. Do we know anything about what makes that happen? attributes of the dev?
terry
Thanks for the ideas Terry!
I don’t have access to any demographics about people through github. All I can get there is a github username, a Real Name, and what their dev stage. Perhaps there’s a way to link this against the OpenMRS ID info, but I don’t know how I would access that data, or what is available based on OpenMRS ID. So I don’t think I can provide any analysis of gender/diversity in this round of analysis, but if we indeed care about this (we should!) we need to make sure we’re actually capturing information to analyze. Can you make sure that we work with the community team at the start of next year for this?
Looking at dev stages is an interesting idea, but I don’t think it’s going to tell us anything this year, since we’ve barely done anything with it, and we haven’t meaningfully promoted anyone. I guess we could look at people for whom the total number of commits in 2015 seems inconsistent with their dev stage, and try to upgrade/downgrade them based on this.
Contributions is the initial mark of community engagement. It might be worth thinking if we can come up with metrics that look further up the spectrum (beyond contributing, toward cooperating, collaborating, and leading). This is just brainstorming on potential metrics, but might give you an idea of what I’m thinking:
In all cases, we’d ideally look across all repos with special attention to openmrs-core and repos for community supported modules & contribs. As you’ve suggested, breakdown by year would be helpful to identify trends.
BTW, I have a GitHubApi.groovy script that, when given your github token, provides easy Groovy access to the GitHub API, including monitoring the rate limit and automatically sleeping if the rate limit is reached. Happy to share if you’re interested.
Darius,
Definitely interested in seeing the results. Some thoughts:
Seems important to get more granular than just number of committers to core vs any repo. Ideally it could be broken down by module, and then rolled up into grouping (Ref App modules, Core modules, etc), but depending on how much work it would be.
Definitely like the idea of trends. Would be interested in looking at all committers from 2015 with more than 10+ commits, and then breaking that down by the number of years a committer has been active. (Ideally we’ve got a distribution of old-timers and newbies) This could be applied across the entire repo.
To Burke’s suggestions:
Not sure what you mean by “Number of commits coincident with commits from other users”?
Not sure I see this as a spectrum. Really I only see “contributing” and “leading” as key, and those are fundamentally different things. I don’t see what “collaborating” captures beyond what “contributing” does… a merged pull request would just result in a commit.
Mark
Please don’t draw any conclusions from this yet, this is really work-in-progress, and you should probably ignore it. But I wanted to write something down.
I played around with nodejs, npm, and elasticsearch to do this analysis, which means I learned a lot, but wasn’t as efficient as possible. ![]()
Looking only at openmrs-core for now. This is misleading, and I’m sure things will look quite different when I pull in other repos
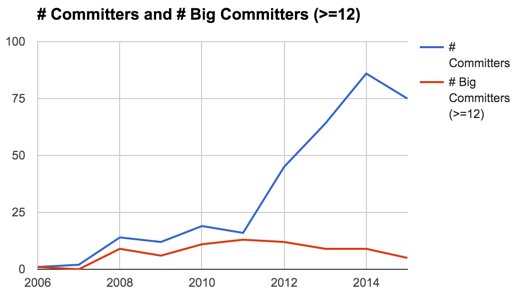
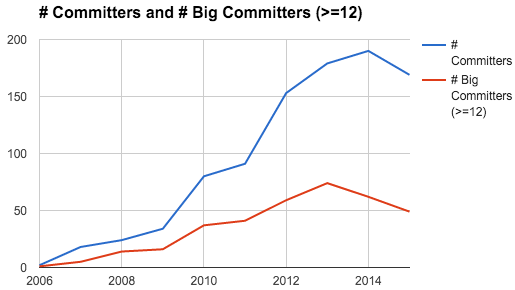
We have had a fast-growing number of contributors, though it actually dropped off this year. However if you look at people with at least 10 commits in the year, we haven’t actually been seeing growth. (In fact, in 3 of the last 6 years we lost more “big committers” than we gained.)
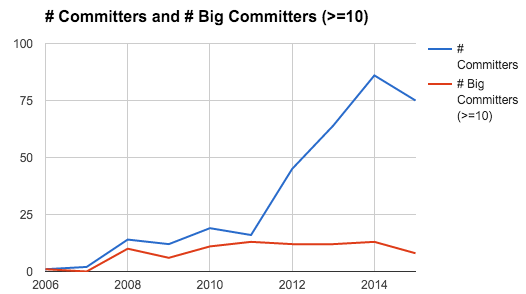
Details of this year:
In 2015 we had 8 big committers (with at least 10 commits) From 2014 to 2015 we… gained 3 (tomaszmueller, kristopherschmidt, mogoodrich) lost 8 (harsha89, jkondrat, dkithmal, pmuchowski, Izaron, vaibhav-hp, geoff-wasilwa, kkaczmarczyk) kept 5 (dkayiwa, wluyima, rkorytkowski, rpuzdrowski, k-joseph)
A random tidbit is that @dkayiwa blows everyone else out of the water for commits to openmrs-core. In 2015 and 2013 he had >3x as many commits as the #2 person. (I guess Daniel must be handling lots more pull requests than others.)
Here’s the google spreadsheet where I’m putting my findings OpenMRS Committers Analysis 2015 - Google Sheets
Just brainstorming ways of detecting cooperative behavior over ad hoc contributions, thinking, for example, commits to the same repo during the same 24-hour period as commits coming from other people could be a proxy for someone working with others (e.g., helping on a sprint).
There’s definitely a spectrum of increasing engagement with the community (left column of dev stages). “Contributing” is contributing code, “Cooperating” connotes some level of coordination of efforts, and “Collaborating” suggests interdependency with others. I agree these distinctions are not easy to make simply by analyzing GitHub data, but thought it might be worth the exercise to see if we could tease out from GitHub data some clues to people advancing through stages of community engagement.
Daniel definitely does stand out in tending to the community (something he enjoys more than most). So, it’s not a surprise that he has more pull request merges. Is it possible for you to detect pull request merges and whose code is being merged (e.g., dkayiwa merging PR from foobar)?
It would be very helpful to know if someone is submitting a lot of pull requests (candidate for advancement). It would be really cool if we could detect or find some reasonably proxy for the amount of change between request & merge. For example, someone who submitted a PR that took a little work to merge followed by 5 PRs that were merged unchanged vs. someone who submitted 10 PRs with increasing amounts of work needed before each was merged.
I’ve spent my budgeted time on this for now, but hopefully I’ll be able to pick this up again for another day sometime before the annual report is due. ![]()
Burke, one meta-takeaway is that pulling all the commits ever made across 40 repos doesn’t take that long (<10 minutes), and the dataset is small enough that we could we could try to construct some brute force metrics of “how good a participant” (or whatever) and run them pretty quickly. That said, I’m not sure it’s easy to tell what’s going on when you merge someone else’s pull request without doing real analysis.
So, here are some findings:
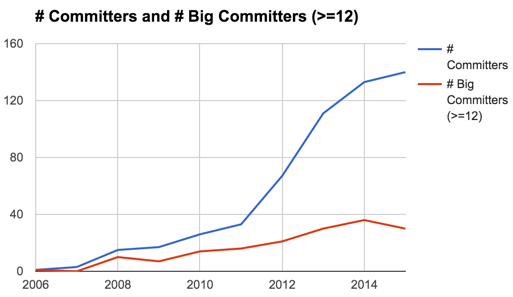
(The fact that the number of committers to openmrs-core drops in 2015, but the number of committers to all the repos doesn’t drop, is probably a good sign that we’re doing lots of application work outside of the core.)
PS- here’s the google sheet: OpenMRS Committers Analysis 2015 - Google Sheets
Okay, likely my final 2015 post on this topic…
I went ahead and re-ran this analysis looking at all code repos owned by openmrs (which is more reflective of the effort put in, but maybe less reflective of real-world utility):
Top line numbers:
Detailed findings:
We peaked at 190 committers last year, and had 169 this year (to date). On “big committers” we peaked at 74 in 2013, and we are down to 49 this year. (It’s worth exploring how much this is a actual bad trend vs whether this reflects us not including all GSoC repos under our github org).
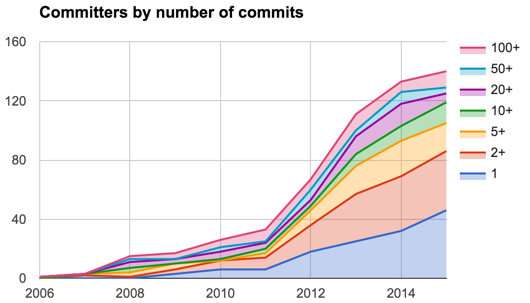
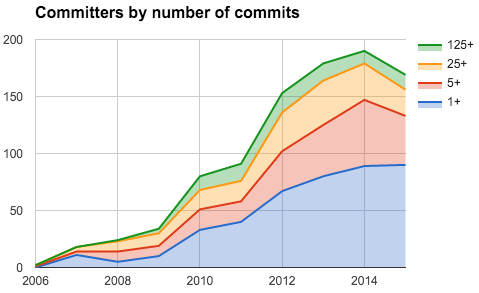
Breaking down by the number of commits we see that this year 50% of committers had 1-4 commits. It is alarming that this has continued to grow, while the number of committers with 5-24 commits is falling:
Our top 20 committers of 2015 were (along with the repos the made >=24 commits to):
696	dkayiwa		core(259), legacyui(75), webservices.rest(73), xforms(36), adminui(34)
516	mogoodrich	registrationapp(110), coreapps(60), uicommons(58), htmlformentry(29), appointmentschedulingui(27), registrationcore(24)
509	rkorytkowski	distro-referenceapplication(70), core(69), openconceptlab(63), contrib-sdk-maven-plugin(43), contrib-uitestframework(39), webservices.rest(30), contrib-maven-archetype-module(24)
367	approce		registrationcore(314), registrationapp(49)
335	djazayeri	ebolaexample(146), uicommons(24)
321	wluyima		adminui(101), core(28), legacyui(28), appointmentschedulingui(27)
249	k-joseph	chartsearch(199), core(36)
246	Ch3ck		dataimporttool(246)
195	tomaszmueller	distro-referenceapplication(147), core(24)
188	harsha89	fhir(178)
144	mseaton		reporting(34)
127	diospark	contrib-sdk-maven-plugin(120)
125	teleivo		radiologydcm4chee(124)
114	sunbiz		radiologydcm4chee(100)
111	Plypy		contrib-id(104)
105	robbyoconnor	contrib-id(82)
102	qszhuan		ebolaexample(101)
96	nataliaplonka	distro-referenceapplication(96)
66	deluan		ebolaexample(65)
60	sashrika	fhir(59)
Details about who we gained and lost: From 2014 to 2015 we… gained 26 (approce, Ch3ck, tomaszmueller, diospark, teleivo, sunbiz, robbyoconnor, qszhuan, nataliaplonka, deluan, sashrika, milankarunarathne, michaelpai, bgeVam, kristopherschmidt, jdegraft, tharunya, lluismf, maimoona.kausar@ihsinformatics.com, HemanthGowda, sravanthi17, kwitczak, suniala, enymuss, preethisadagopan, yulia-kh)
lost 39 (elliottwilliams, alexisduque, glauberramos, mario-areias, vaibhav-hp, pamcdm, luizasouza, rowanseymour, elixdlol, bmamlin, pmori@pmori.local, tallevi12, ningosi, endeepak, milinda-ruk@github.com, orhemi, lnball, marcioviegas, kkaczmarczyk, Izaron, jlkeiper, mihirk, dkithmal, ujjwalarora, geoff-wasilwa, superkey, albertsaave, lsouza@amplify.com, downeym, mlennon3, arathyjan, ehaligowska, fbiedrzycki@soldevelo.com, mhawila, romulobr, indraneelr, madawas, raigons, vinkesh)
kept 23 (mogoodrich, dkayiwa, djazayeri, wluyima, rkorytkowski, mseaton, Plypy, cintiadr, kkalfas@soldevelo.com, vineetv2821993, yatesr, andreweskeclarke, k-joseph, surangak, smalecki, harsha89, jkondrat, vinayvenu, rpuzdrowski, cioan, pmuchowski, shruthidipali, jobasiimwe)
…taking a closer look at those we lost as big committers from 2014 to 2015
Darius this provides some insights that i didnt have–and give us opportunities to look at these graphs and figure out what/ where we should change. We should include these on a community management team meeting so that we can evaluate them further and figure out if there is a ‘response’ to them.
in addition, i think that most of this should go into the annual report–to indicate what we are tracking/ why/ what we do with the info. thanks for spending your time doing this…
would be really interesting to compare to another open source HIT community to see if this is a familiar pattern that is observed. have a great holiday… terry
Very interesting and worthwhile, thanks for doing this @darius. Not sure exactly what conclusions to draw from it yet, though very happy to see than I’m #2! 
Mark
Good job Darius! It’s good to see my commits going down