OpenMRS startup time analysis

We’ve been hearing for quite some time now from people (including me) complaining about the OpenMRS startup time. We’d love to do something about it.

I’ve taken some time to do an analysis and come up with recommendations so we are clear on possible outcomes.

The tests were conducted on the hardware with Apple M1, 16 GB of RAM allocated for Docker Desktop and SSD running ‘docker compose up’ from https://github.com/openmrs/openmrs-distro-referenceapplication/tree/3.x-core-2.8 that is OpenMRS O3, which is based on OpenMRS core 2.8.x and 28 modules. The base core image is running on JDK 8 and Tomcat 9.

To start with I measured the startup time with an initial setup (db schema and demo data creation), which was 8 minutes 29s. The consecutive startup times are much lower and we’ll be investigating them going further.

Based on the startup logs, the entire startup process took 45.8 seconds. A number of debug messages were added to measure time at different stages.

On more modest hardware it can be significantly slower. In addition the startup time can be affected by e.g. custom modules (additional Liquibase scripts, module initialisation methods, known circular dependency issue, see TRUNK-6421) and extra import data to process (via Initializer).

The startup was performed across multiple containers (db-1, backend-1, gateway-1, frontend-1), with the majority of the application logic and initialization occurring within the backend-1 container.

Logs Analysis

Here is a breakdown of the time taken by the main high-level steps:

Startup Phase Duration Details
1. Infrastructure Initialization 1.000 s Time until the MariaDB database (db:3306) was available to the application backend.
2. Tomcat Bootstrap 1.402 s Time from DB readiness until the Tomcat server component began its initialization process.
3. Web Application & Spring Context Initialization 11.444 s Time from Tomcat start until the Spring Web Application Context (WAC) was completely refreshed and initialized.
4. Module Startup 31.949 s Time taken for all 28 modules to be loaded, processed and initialized.

Looking at logs we can also tell that refreshing application context happens twice. The first time is without any modules in the 3rd stage, which takes ~5s and the second time is with modules in the 4th stage, which takes ~22s.

Also in the 3rd stage, we run Liquibase checks, which take 5s.

Profiler analysis

Further analysis with a profiler allows us to break-down stages. We’ll be using YourKit profiler connected to Docker agent. Please note the timings are different with a profiler as profiler sampling slows down the process resulting in the total startup time being 143s instead of 46s. The timings from the profiler can be divided by 3.

Here’s a list of the most time consuming methods ordered by time spent in them alone (not including child calls) (2nd column):

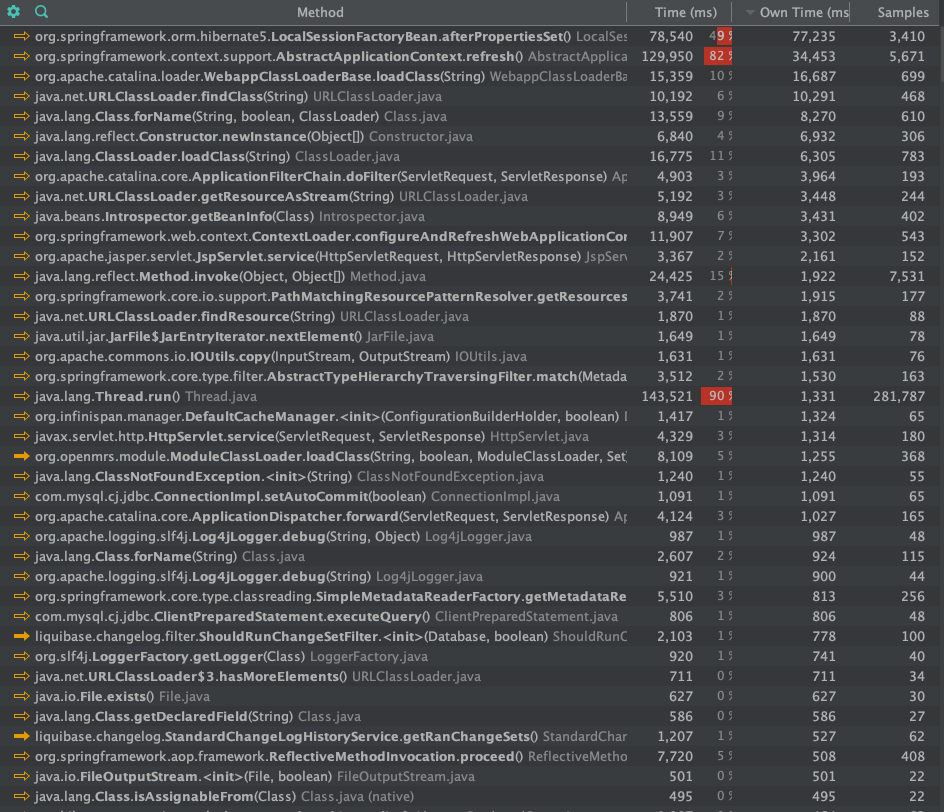
It confirms that refreshing application context contributes greatly to the startup time (130s of 143s total). It consists of Hibernate session creation taking 77s, creation of Spring context taking 34s and the rest being mostly class loading 19s.

The next big contributor is ClassLoading. The time spent in class loaders alone is ~48s (summing up loadClass, forName, findClass, getResourceAsStream, findResource methods own execution time). Much of the class loading happens during refreshing application context.

Recommendations

If we want to make significant improvements to the startup time, we shall:

  1. Implement startup performance test to measure improvements

  2. Switch default image from JDK 8 to JDK 17, which speeds up startup by 10s, 22% speed up (thanks to improved class loading).

  3. Do not run Liquibase checks on each startup, which speeds up startup by 5s, 11% speed up, see TRUNK-6418

  4. Eliminate the need to refresh Spring application context twice (or parts of it), which should save us at least 5s, which is 11% speed up.

  5. Optimise module loading, which should give us at least 10% speed up.

    1. Do not expand jars on each startup, but keep them expanded between restarts instead

    2. Optimise class loader methods with caching

  6. Issue startup warnings if module mixes annotations and xml declared services (slows down startup time by 10 times, see TRUNK-6363)

  7. Implement partial reload of jars and Spring context similar to Spring Boot during development with even 50% speed up when hot-deploying Java code changes, see Spring devtools.

If we want to improve the initial setup of O3 we shall:

  1. Generate demo data at build time and import ready to use demo data set at runtime, which gives us back 4 minutes 28s, 52% speed up compared to the total startup time with initial setup of 8 minutes 29s.

  2. In clustered environments we shall not run data imports on each node rather use a single node to do imports, see TRUNK-6418, reduced new node setup time by at least 2 minutes 47s

All this work can be followed at TRUNK-6417.

Please let me know if you have any questions, comments or see other possibilities for improvements.

7 Likes

Let me also include code changes with extra logging and profiling config:

3 Likes

I’m less concerned about the time the demo data generation takes. We actually already build and create pre-populated versions of the database (the issue here being that doing so requires spinning up the app, which breaks the ability to publish architecture-agnostic images pre-populated with data, so we publish images, but x86-64 only). And, ultimately, demo data generation is not really something anyone should be using in a production system, so while it’s a “big“ issue in the RefApp start-up time, I’m not sure optimizing it will really help.

Do we have some instructions for how an implementation could run the same log analysis and profiler? It might be useful if we could collect similar start-up timings from real world implementations.

1 Like

I’ve attached code changes in core I needed to make to get the timings in logs. We could commit the extra log messages to core.

The profiler I used was YourKit, which is a commercial tool. The setup is documented on their website and it depends on your deployment. I’ve done it for the docker deployment, which you can see in the second commit I linked.

2 Likes

In addition to what @ibacher has said, i would prioritise these efforts by starting with what implementers do most of the time. And that is, the normal restarts of openmrs.

4 Likes

FWIW, we do have a couple of YourKit licenses (though we might need to re-up them… I can’t remember when we last did).

1 Like

Speaking of it would be good to get some implementation feedback here. @mogoodrich @mseaton @pirupius @pwargulak @makombe @slubwama and others I’ve forgotten, it would be useful if you could at least replicate this in your distros with the log analysis. The code is basically a patch for OpenMRS 2.8.x that adds some debug messages at key points of the application startup (see the commit @raff linked above).

@raff Maybe we can add those logging messages to core? Their debug so they’d only show up if someone opted-in via modifying the logging context.

2 Likes

Thanks @raff !

I agree that startup time is an issue for us, and for some of our servers, doing a restart can be 5+ minutes.

I also agree that I’m not really concerned about the initial setup time.

I haven’t dug in deeply in years but the steps you mention @raff do sound like the areas I’ve seen cause startup problems in the past.

I hadn’t seen Jira before, this is definitely interesting… @mseaton @cioan @chibongho1

1 Like

Yes, I mentioned we could commit the messages to core. We could even back-port if we want implementations to report back results for different versions of core. [Done in TRUNK-6436]

One thing I should have mentioned is the JDK version. I used JDK 8 for testing, which is still our base version and when I switched to JDK 17 it was 10s faster thanks to improved class loading. The difference between JDK 17 and 21 was negligible. I think it’s time to make JDK 17 the default base for our docker images. I’ll update my first post with this observation.

Also I didn’t indicate that running liquibase checks in core takes 5s and we can eliminate that easily with TRUNK-6418.

2 Likes

The demo data can be generated once using any architecture and then added to all architecture images since it’s just a SQL script.

2 Likes

@raff i just wanted to confirm that i also noted a significant performance improvement by simply switching to Java 17 :slightly_smiling_face:

4 Likes

Just to respond to this - we are starting to work on testing out our PIH distributions against 2.8.x, but have some work to do to get things upgraded. I will report back here with timings once we have them.

1 Like

Sorry I’m unclear - what’s the next step @dkayiwa @ibacher for @raff to take on? Is there a killer, super valuable next-step you’d like to green-light? Should Raff proceed with these Recommendations?

Yes. That’s already been agreed to.

1 Like

I will repeat this for emphasis. For the first attempt, i would concentrate on the time for restarts, after openmrs is fully set up, instead of the initial start up time. Because this is typically what implementers deal with 99.999% of the time.

2 Likes

I’d start with the first 5 recommendations from the list. They are the most impactful. Also I’d re-check timings after each improvement and decide if the impact of the next is worth the effort or it can be skipped.

Also most of the improvements are backwards compatible, thus I’d consider having them in the 2.9.x release to make it available sooner for implementers than 3.0.x. The 3.0.x release may take a lot of time to release in the current pace.

2 Likes

I love this. :+1:

1 Like

I have a branch of our “PIH EMR” distribution that is building and running with 2.8.1, so am in a position to gather some metrics. Doing a few test runs using our current 2.7 vs. branch 2.8, nothing stands out as massively different. These are both using Java 8 still.

I did enable the logging as suggested by the code that @raff committed, but it feels like just enabling that additional logging added significantly to the startup time, and it isn’t super easy to actually distinguish between useful logging messages focused on timing vs. other logging that is occurring. I’d recommend we either log these timing-based messages using a particular logging marker, and then add in a log4j configuration that logs messages with that particular marker to a specific file. I’d also recommend we add deliberate timing collection to areas of particular concern so that these are easier to pull out an analyze from one startup to the next without having to do extensive work reviewing each log file.

@mseaton thanks! Yes, I considered using a marker, but then additional log messages turned out to be quite helpful to understand what’s happening under the hood. If one just needs to compare timings then it makes sense to use a marker, but if you want to make improvements then timings alone are not enough. Would you be in position to e-mail me your startup logs so I can have a look?

1 Like

@mseaton did you know that we do publish different variants of openmrs-core with jdk 11, 17 and 21? https://hub.docker.com/layers/openmrs/openmrs-core/2.8.1-amazoncorretto-17/images/sha256-813400b08372ab7941e88587a558c03361ecd4182644b24400e320bb45af5c18