The config has a key called “function” where an actual function called bmi gets used, should this function be defined somewhere? or is the possible solution something else?
It is, but in a slightly convoluted way (specifically, it’s defined here).
The problem seems to be accessing some data via the REST interface… Is there anything earlier in the server logs? Alternatively, in your browser network tab do you see a failed request for either the /concept or /obs endpoints?
There is a similar request error involving the other concept ‘5090AAAAAAAAAAAAAAAAAAAAAAAAAAAAAAAA’ as well.
PS: Both these concepts exist in the Dictionary and if I remove the line with the “function” key from the config (which is Ln. 14 here), the widget works perfectly fine.
So the problem with the request is definitely the single-quotes that get added there. It must be returning some kind of error that isn’t properly converted.
Presumably, though, you don’t see a graph of the BMI right? If you don’t need it, I suppose we can stop there…
However, another option. The “function” entry in both the example config and the config used in coreapps has this:
Yes! that is working…the additional quotes seem to be unnecessary after all (and in fact are the trouble makers).
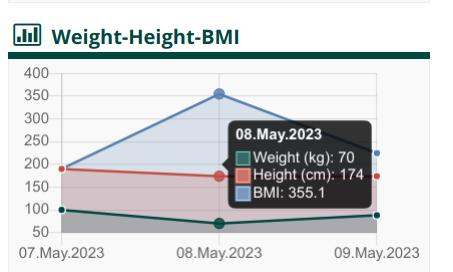
With the additional quotes removed and the Widget config changed to this, a nice multi-variable graph is produced showing Weight, Height & BMI:
However, if you observe the value of the BMI…it is 10x times more than the expected. But, that is a different issue altogether…and we will have to look through the function being used for this calculation and other pieces of codes.