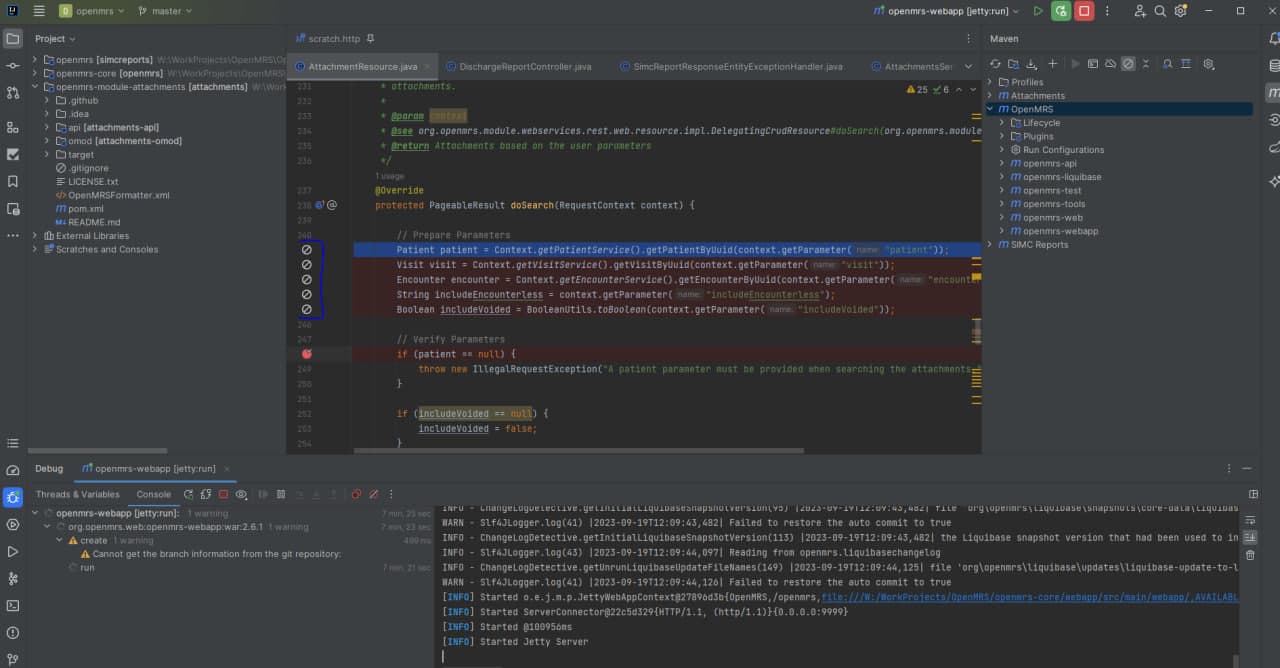
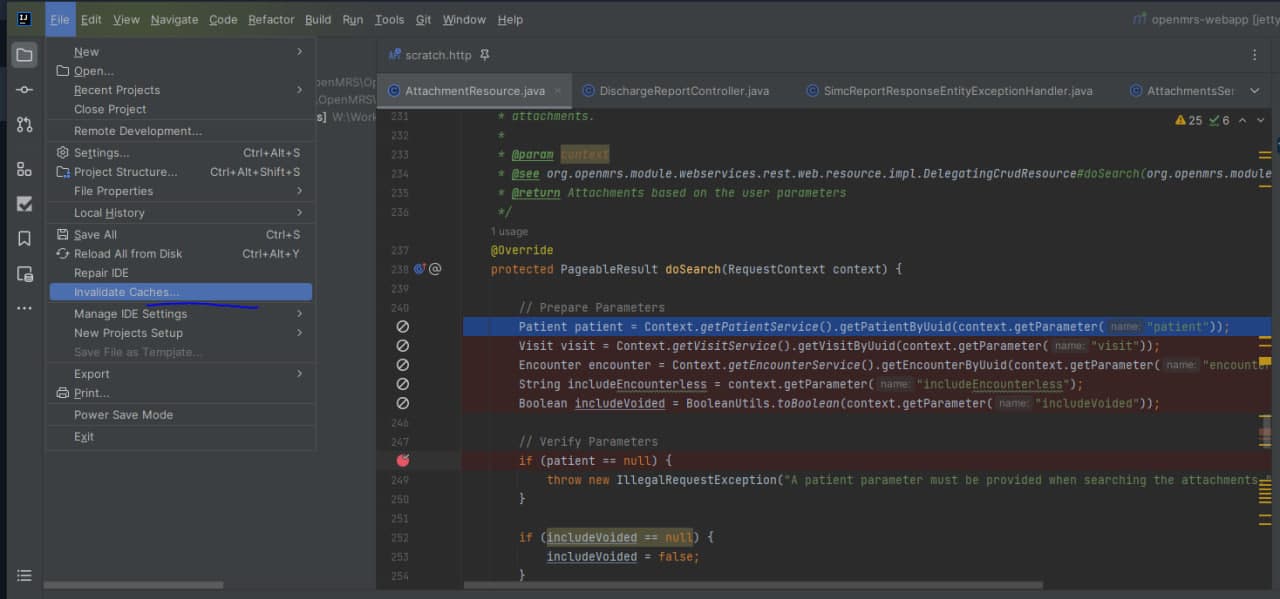
Hi all Which developer has encountered a problem debugging a module (openmrs-module-attachments) in (intellij idea 2023) with a breakpoint error in the images below: (clearing the cache did not help, setting Maven in (true) and (lines,vars,source) did not help)

You definitely restarted the Jetty instance after copying the attachments module? That’s the only thing I can think of.
I restarted jetty, under debugging, every time I changed something in modules or added new ones => they are loaded and reloaded in the main Runtime
Moreover, I cleared the cache in the .openmrs-lib-cache modules directory
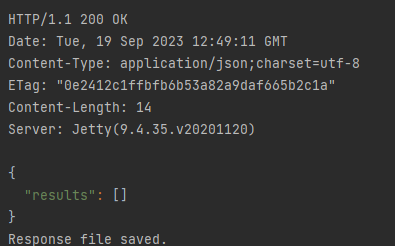
What’s the output from the end point /openmrs/ws/rest/v1/module/attachments?
The result is without errors, my goal is to study the operation of this handler, since at the moment we do not receive attachments without observations
But the question I had was not about this, but why not all breakpoints in omod modules in the IDE do not work.
Right; I have no generalised explanation for that because breakpoints in OMODs in the IDE do work, provided you have the right version of the OMOD (i.e., the version in the IDE matches the version deployed on the server). This inclines me to think that the reason it’s showing all those breakpoints as “not executable” is because the corresponding class file isn’t loaded into the OpenMRS instance at all, which can happen if the module failed to start for some reason.
I would’ve expected the request I gave you to yield something like this:
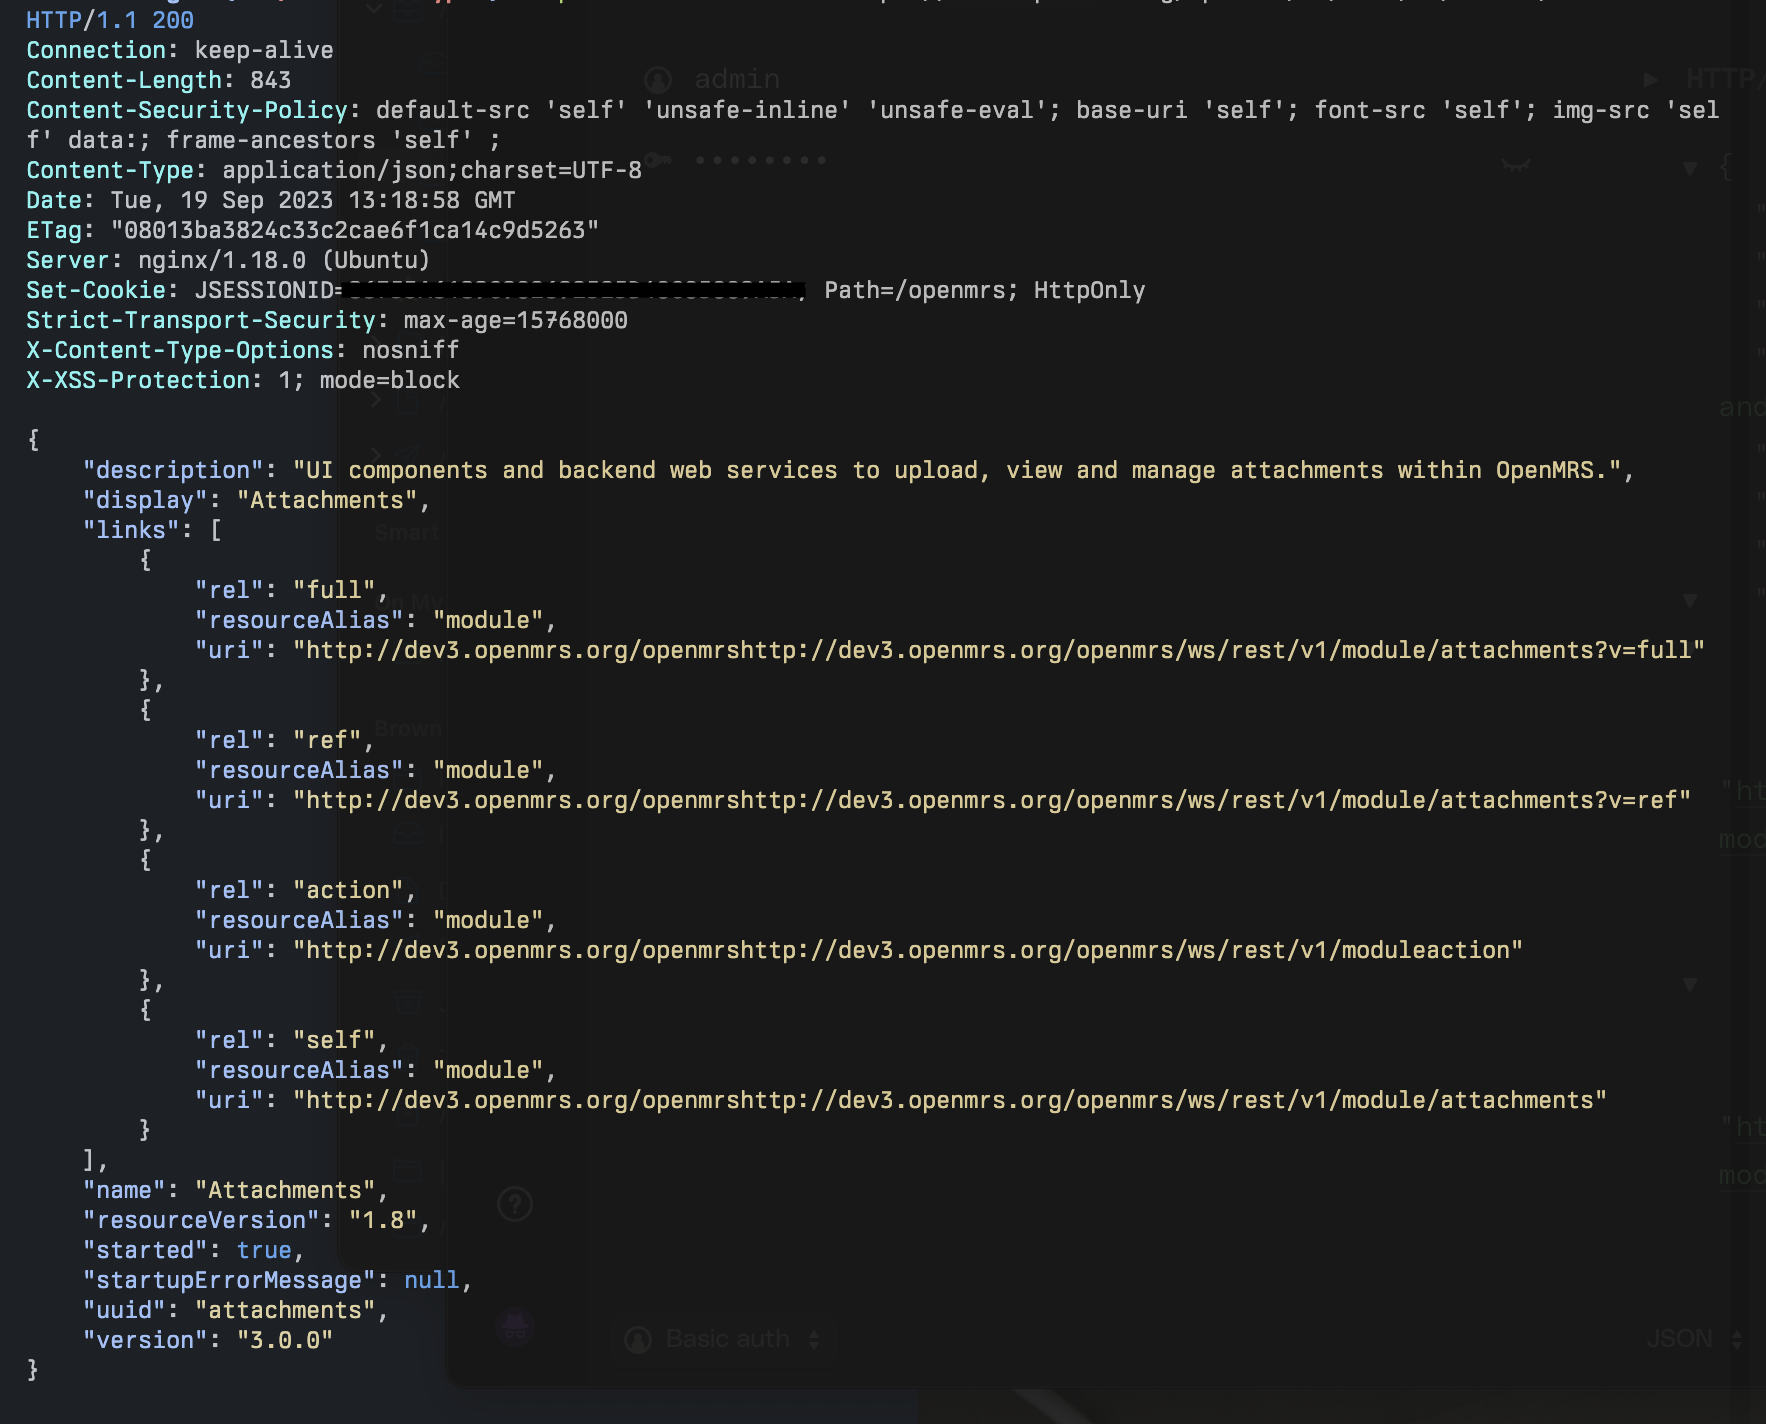
I’m not exactly sure which URL the request you show is for…
I collected the code for the openmrs-module-attachments module in the IDE and manually copied the resulting OMOD to the home directory where the loadable modules for the openmrs-core jetty plugin running are located (I displayed it in the images above in the topic)
The openmrs-module-attachments module is partially debugged, breakpoints are not set everywhere, as if the result is a different byte code and does not correspond to the source code, which is strange, since I specifically translated it back to the source code and it was almost similar to the source code code, only without comments and was slightly shifted, but all the variables, properties, etc. were the same as in the original source code, but for some reason the debugger cannot set breakpoints everywhere.