Measuring Interest for Data Dashboards

Hi All

We at Mekom have been asked to build a Data Dashboard for the ICRC project. While doing so we would like to know if there is any interest in such a feature from the broader community. As usual, having involvement from other teams helps the feature live a better life and also potentially influences architecture decisions in order to support (or at least future-proof against) broader use cases. So, please let us know if this topic is interesting to you.

Here is a brief overview of the feature as I currently understand it from @delphinep and team.

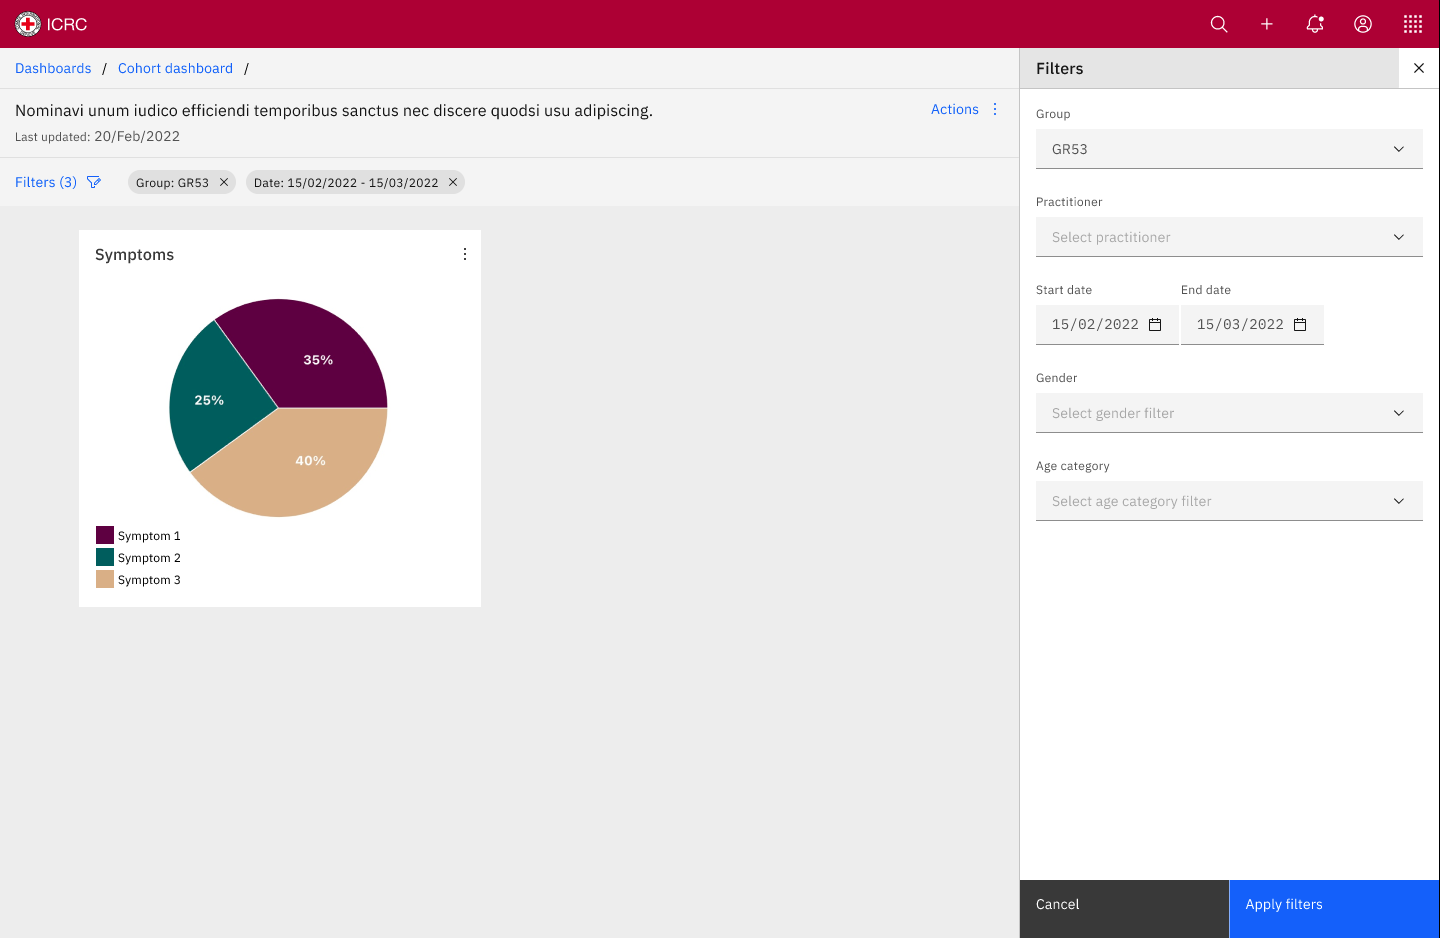
Let’s start by saying that a Data Dashboard is made up of Chart Widgets

Chart widgets contain things like the following:

  • Pie charts: “age groups of patients”, “gender of patients”, “locations of patients”, “types of violence” , “types of vulnerability”, “types of symptoms”, “percentage of perpetrators that are weapon-bearers”
  • Lists: “patients who have missed last 1,2,3 months of group sessions”
  • Numbers: Counting patients with “sleeping problems”, “suicidal ideation”, “victims of rape that have not recieved medical attention”
  • Bar charts: “missing data by form type”
  • Histograms: “pre/post-scores of a program”, “days between event and data entry”
  • Misc: Difference between Pre-scores and Post-scores to see effectiveness of a program

Combining widgets then makes up a dashboard. A program coordinator can create program-wide standard dashboards. Each user can modify a dashboard to add or remove above “widgets”. They can rearrange widgets on the page. Dashboards can be saved, copied, and shared.

There is also a need to have all widgets be globally affected by filters. I.e. all widgets will simultaneously filter down on parameters: practitioner (session and admission), structure, group, location, country, region, program, date range (session and admission), gender, age range, referral from, referral to, type of violence, weapon-bearing perpetrators).

Once this point is reached though no further drilling is allowed - Specifically it is not expected at this time to go from this dashboard into a patient’s chart.

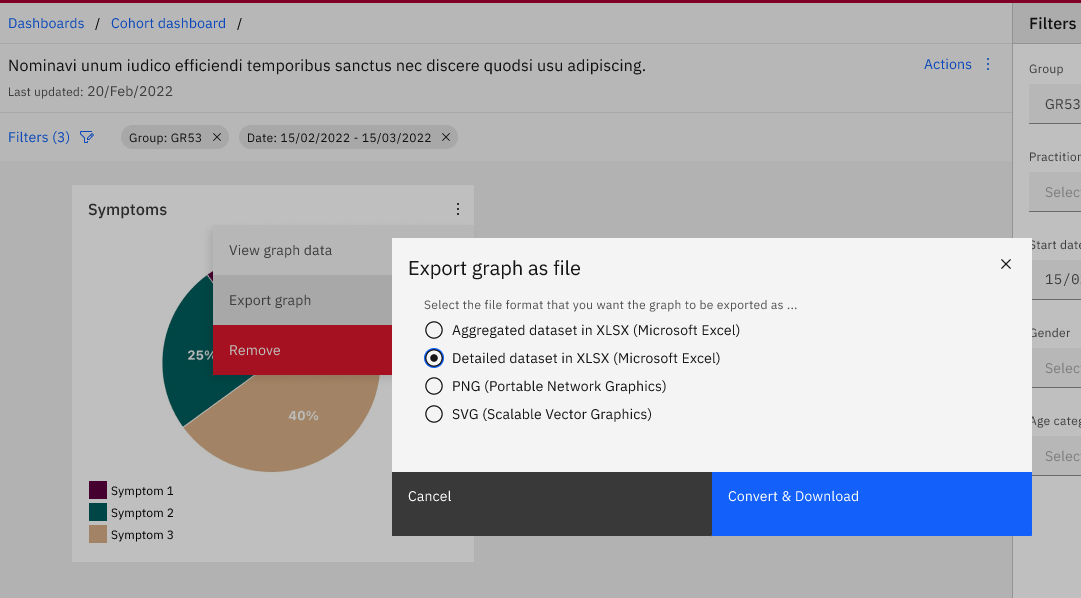
To get past this it is allowed that some user can “download data” so that they can do further drilling if they want. What all this data download includes is not very clear, but it would potentially have patient identifiers, but not names or addresses.

Currently there is an interest to build this product in OpenMRS using Carbon chart components (roll it ourselves). There has been many and intense discussions about instead using either existing licensed or open source BI tools. There is some hope from the team that this is simple and straightforward work and we will not need to interface with another product, but anyway we are making work estimates for both. The team wants that the scale of the product will be contained with minimal scope creep. The current list of user stories is here.

Please leave comments below. @delphinep will be responding to questions on this thread.

Thank you

2 Likes

Thanks @zacbutko!

@burke and @grace, can we take this to Monday’s TAC already? Even though we keep awaiting here reactions from the broader community.

Cc @ssmusoke @mseaton @mogoodrich @eudson @jdick

1 Like

Thank you @zacbutko and @mksd for starting this discussion. Indeed we would like to know what is the interest of the community to support basic dashboard reporting widgets in OpenMRS 3.0, to provide some simple visualization of data to OpenMRS users. This is not meant to replace the use of a BI tool for specific users. cc @grace @jesplana @frederic.deniger @icrc.psousa

1 Like

Thank you for starting this thread, it truly is of interest to the UgandaEMR team

My biggest question will be on the approaches for how to query the data from the backend for the charts

  1. SQL Queries

  2. Can we use the reporting module and expose JSON template renders for the end-points

  3. How can I mix content from 2-3 different API end-points (would the data be mixed and matched) without having to build custom end-points all the time

There’s a long history of reporting efforts within OpenMRS. One of the most successful & broadly useful solutions that got us through much of the journey through 1.x and 2.x was a reporting framework developed by @mseaton and the folks at PIH. Many orgs have looked for alternatives from this bespoke internal (OpenMRS module) approach to reporting directly from the normalized operational database because of performance issues (either slowing down the operation system and/or taking a long time to generate reports). Unfortunately, the majority of efforts to create flattened data for analytics/reporting needs has been done as siloed efforts (e.g., AMPATH, Mekom, PIH, Palladium, UCSF, etc.).

The OpenMRS community would benefit greatly from a shared approach to analytics; however, experience has shown that building analytics directly within the operational system (against the runtime database) has significant performance and scaling limitations. Also, given the number of freely available tools in this space (e.g., Apache projects), we should be leveraging existing powerful open-source solutions in this space instead of building our own.

@mseaton and I have been talking within the Analytics Engine Squad calls about a strategy for reporting within the OpenMRS community and came up with this proposal:

tl;dr - get two or more orgs aligned on a shared approach to CDC (change data capture) using debezium to generate some high value proof of concept tables (e.g., flat row-per-encounter & row-per-patient tables that are automatically kept up to date).

If you are going (or are forced to go) down the road of re-inventing the wheel inside OpenMRS and building OpenMRS-specific business intelligence tooling, I would suggest quick hacks that (1) can be thrown away once we have a more shared solution and (2) free up some of your dev cycles to help contribute to a shared solution. :slight_smile: As @ssmusoke points out, you could probably get most of what you need from the reporting module for a near-term solution.

1 Like