Hey everyone! ![]()
As part of my @GSOC project with @OpenMRS, I’ve been working on improving the performance of the OpenMRS 3.x backend. In this thread, I’ll walk through specific API endpoints that are facing timeout issues, backed by metrics from our Gatling testing reports. ![]()
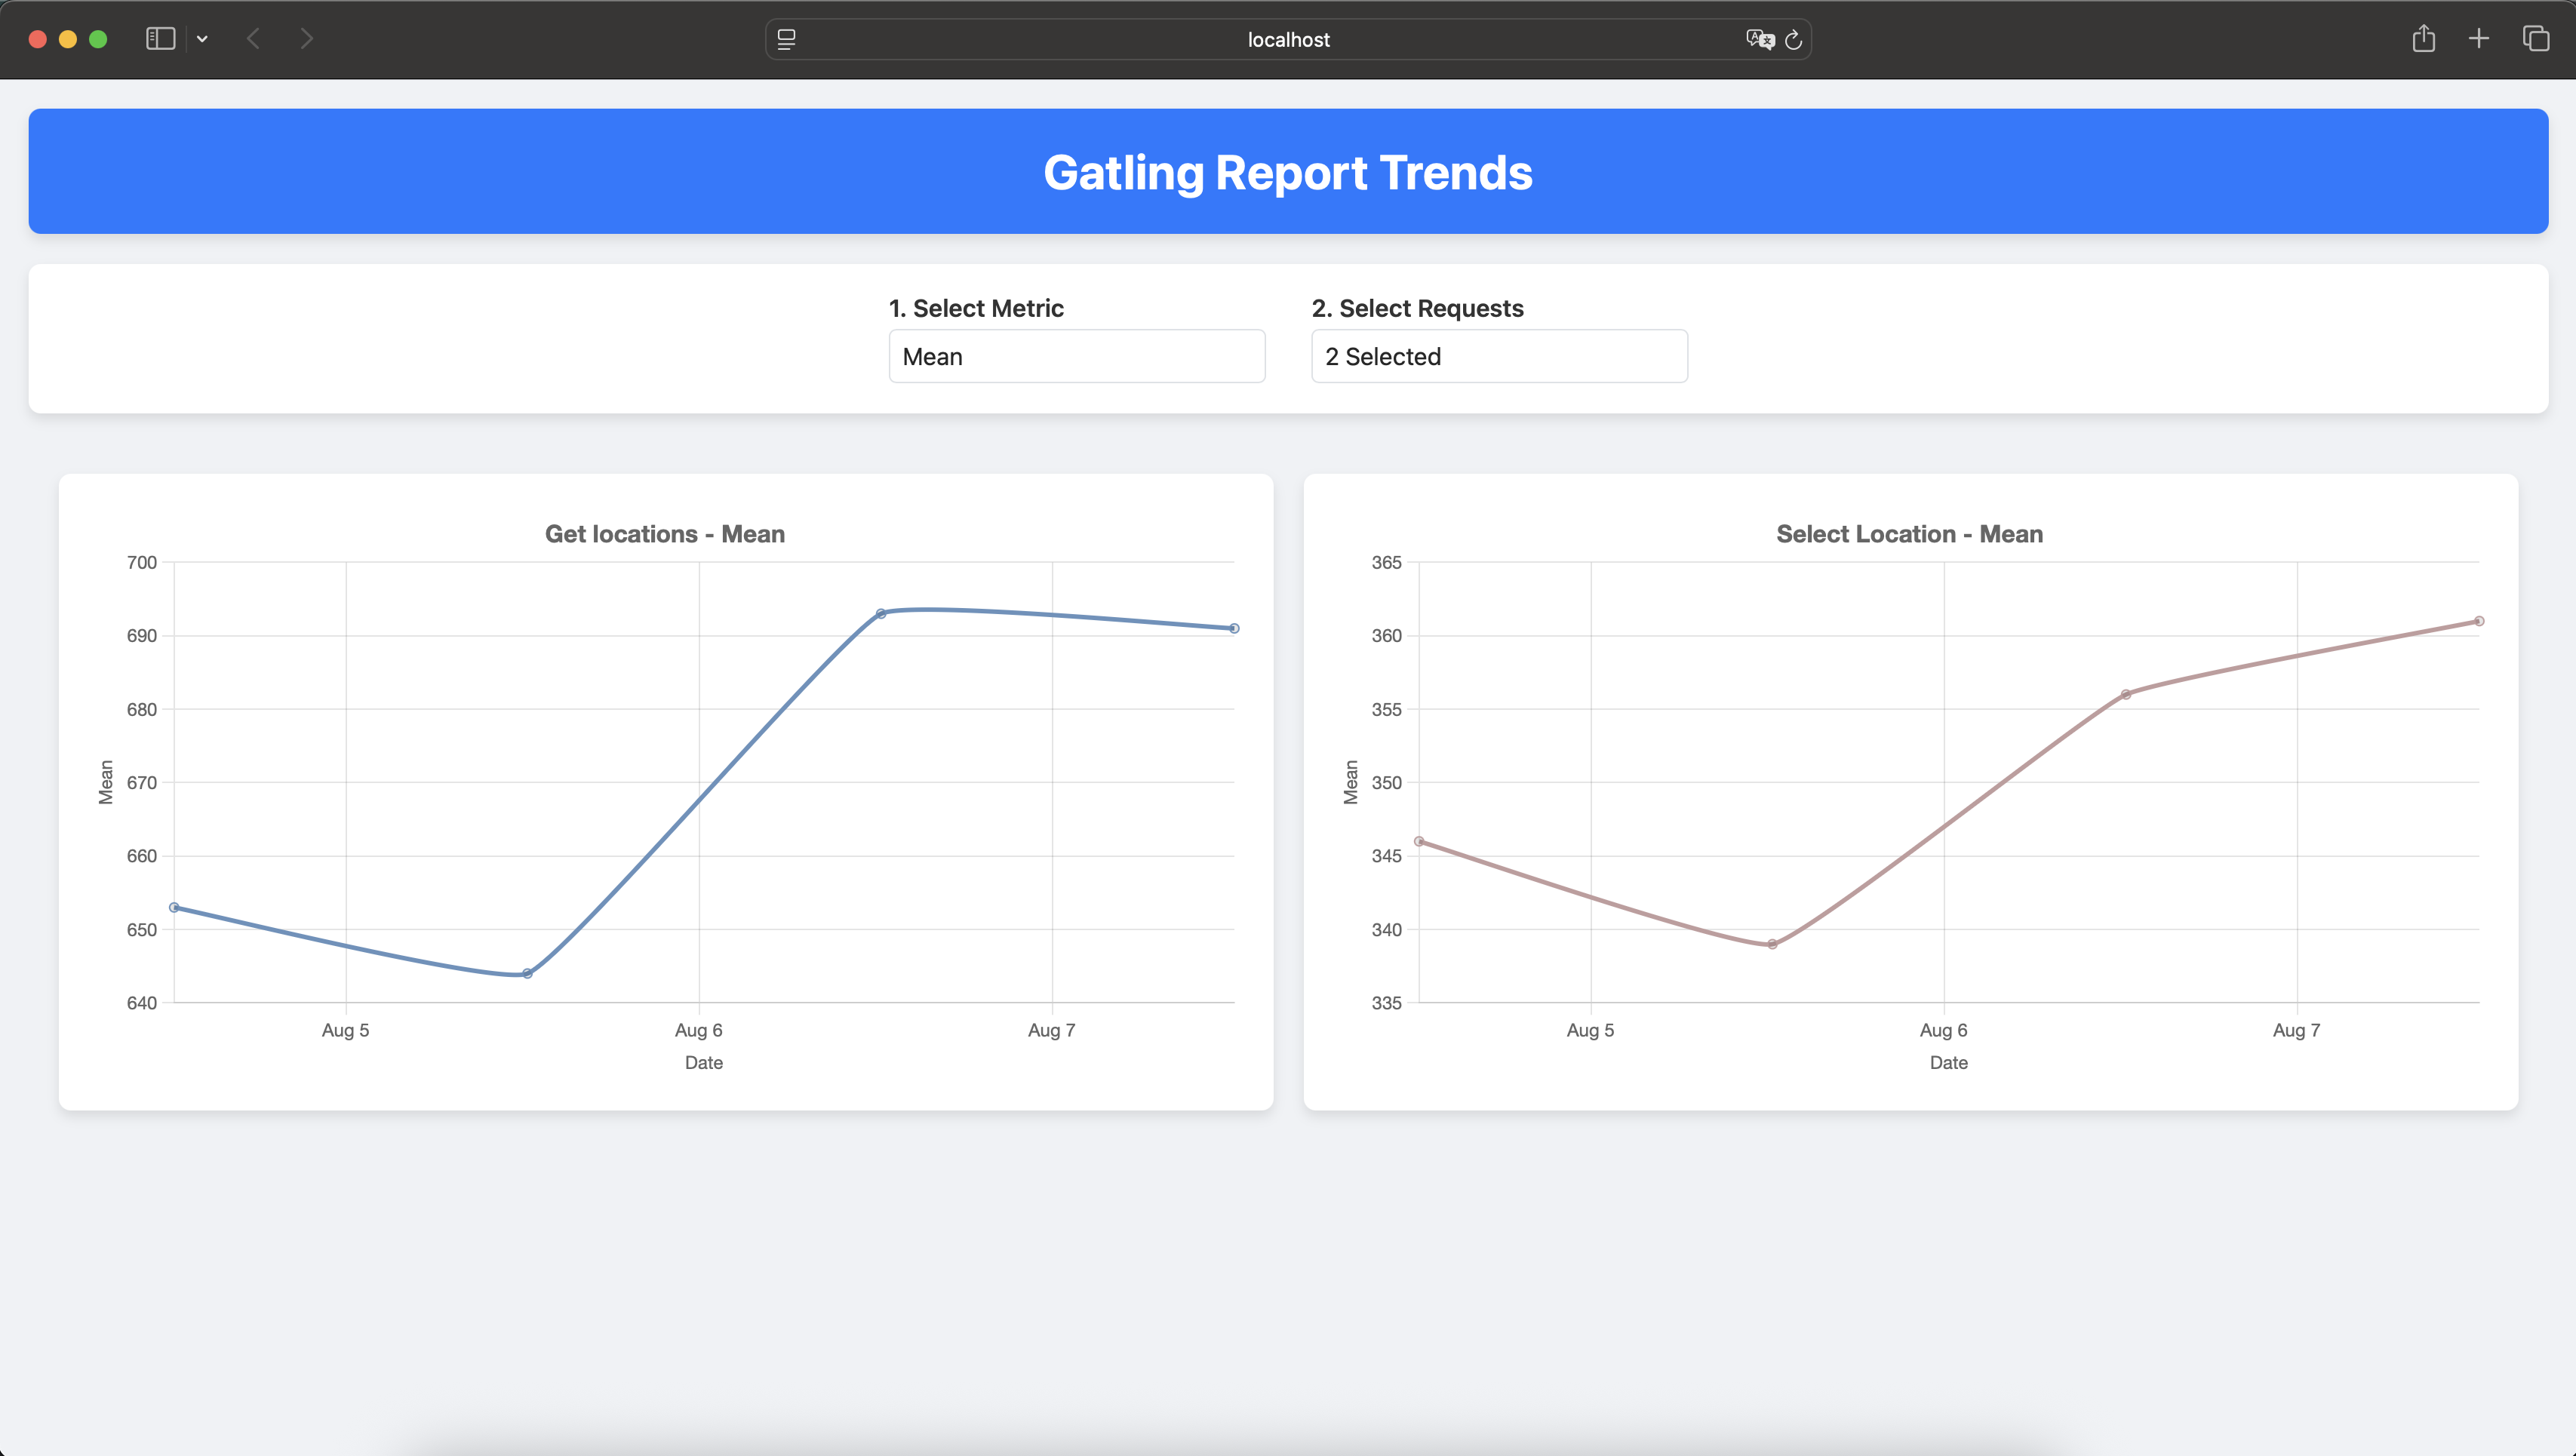
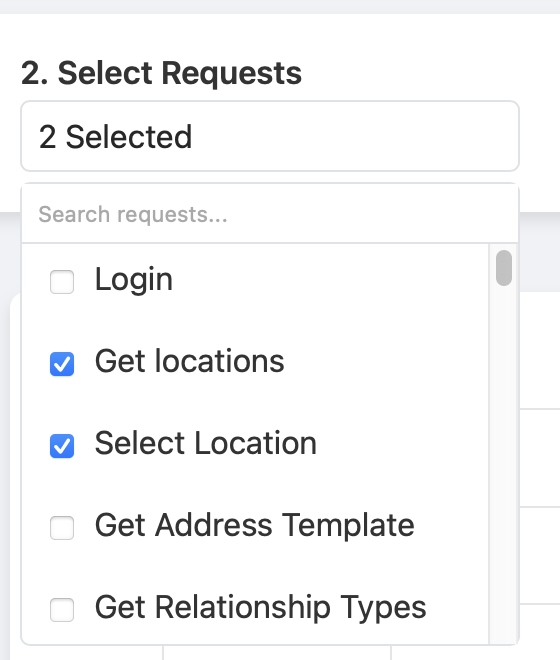
![]() Report: https://o3-performance.openmrs.org/index.html
Report: https://o3-performance.openmrs.org/index.html
 URL 1:
![]() /openmrs/ws/rest/v1/patient – Get Patients
/openmrs/ws/rest/v1/patient – Get Patients
Used to fetch patient data with detailed fields.
Request URL:
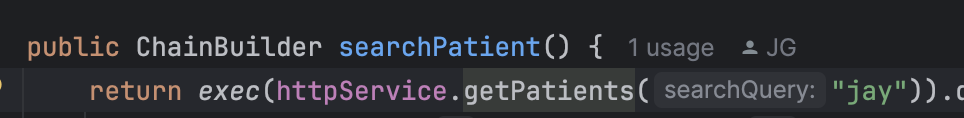
/openmrs/ws/rest/v1/patient?q=SEARCH_QUERY&v=custom:(patientId,uuid,identifiers,display,patientIdentifier:(uuid,identifier),person:(gender,age,birthdate,birthdateEstimated,personName,addresses,display,dead,deathDate),attributes:(value,attributeType:(uuid,display)))&includeDead=false&limit=50&totalCount=true
![]() Timeout %: 28.64%
Timeout %: 28.64%
![]() Median Response Time: ~51s
Median Response Time: ~51s
URL 2:
![]() /openmrs/ws/rest/v1/emrapi/inpatient/request – Get Inpatient Request
/openmrs/ws/rest/v1/emrapi/inpatient/request – Get Inpatient Request
Used to fetch inpatient data related to admission/transfer requests.
Request URL:
/openmrs/ws/rest/v1/emrapi/inpatient/request?dispositionType=ADMIT,TRANSFER&dispositionLocation=LOCATION_UUID&v=custom:(dispositionLocation,dispositionType,disposition,dispositionEncounter:full,patient:(uuid,identifiers,voided,person:(uuid,display,gender,age,birthdate,birthtime,preferredName,preferredAddress,dead,deathDate)),dispositionObsGroup,visit)
![]() Timeout %: 4.05%
Timeout %: 4.05%
![]() 95th Percentile: ~49s
95th Percentile: ~49s
URL 3:
![]() /openmrs/ws/fhir2/R4/Observation – Get Lab Results of Patient
/openmrs/ws/fhir2/R4/Observation – Get Lab Results of Patient
Fetches lab observations via FHIR for a given patient.
Request URL:
/openmrs/ws/fhir2/R4/Observation?category=laboratory&patient=PATIENT_UUID&_count=100&_summary=data
![]() Timeout %: 2.95%
Timeout %: 2.95%
![]() Max Response Time: ~60s
Max Response Time: ~60s
URL 4:
![]() /openmrs/ws/fhir2/R4/Observation – Get Patient Observations
/openmrs/ws/fhir2/R4/Observation – Get Patient Observations
Returns filtered clinical observations for the patient using concept codes.
Request URL:
/openmrs/ws/fhir2/R4/Observation?subject:Patient=PATIENT_UUID&code=OBSERVATION_CODES&_summary=data&_sort=-date&_count=100
![]() Timeout %: 2.93%
Timeout %: 2.93%
![]() 99th Percentile: ~60s
99th Percentile: ~60s
![]() A Key Insight
A Key Insight
In our current setup, only 250 patients are repeatedly used across simulations. Over time, this leads to data buildup per patient — including clinical forms, observations, and historical records.
For some endpoints (like observations and lab results), this accumulated load per patient could be a major contributor to timeouts.
But it’s also important to note: not all slowdowns are due to this.