I’ve spent my budgeted time on this for now, but hopefully I’ll be able to pick this up again for another day sometime before the annual report is due. ![]()
Burke, one meta-takeaway is that pulling all the commits ever made across 40 repos doesn’t take that long (<10 minutes), and the dataset is small enough that we could we could try to construct some brute force metrics of “how good a participant” (or whatever) and run them pretty quickly. That said, I’m not sure it’s easy to tell what’s going on when you merge someone else’s pull request without doing real analysis.
So, here are some findings:
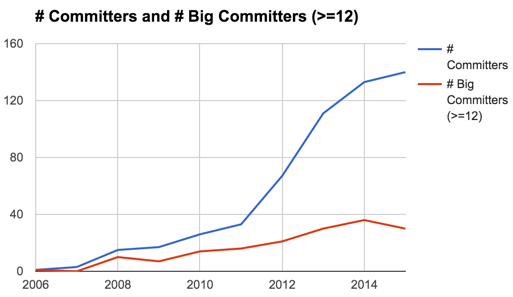
- Looking across many “important” repositories we see lots of growth, though a worrying drop from 2014 to 2015 in the number of people making 12+ commits. (I chose 12 as the cutoff as “averaging one commit per month”, though perhaps people who joined late aren’t being correctly classified here.)
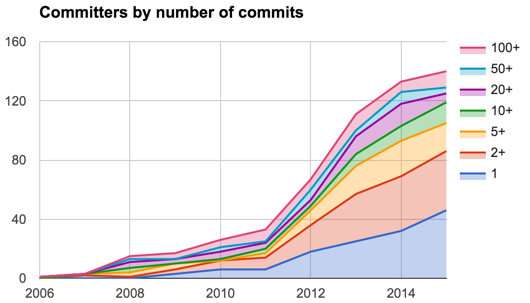
- When we break this down by the number of commits, we see that more than half of our 2015 committers have less than 5 commits.
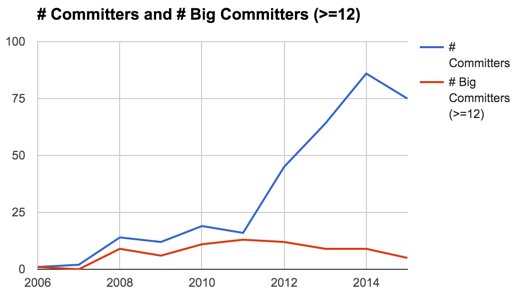
- Looking only at the openmrs-core repo shows us a worrying drop in the number of “big committers”. (I changed the cutoff from 10 to 12 commits to be a “big committer” and this makes things look worse than in my previous email. Actually for the last 4 years we lost more “big committers” than we gained.)
(The fact that the number of committers to openmrs-core drops in 2015, but the number of committers to all the repos doesn’t drop, is probably a good sign that we’re doing lots of application work outside of the core.)
PS- here’s the google sheet: OpenMRS Committers Analysis 2015 - Google Sheets