Well, break-points don’t exist in code. They are entirely a fiction of your IDE, and that’s the important part.
What you need to do is deploy the OMOD to the modules file, as you are doing, run mvnDebug jetty:run, but then ensure that your IDE has the attachments module project open and that it’s from that window that you connect the debugger to the OpenMRS instance.
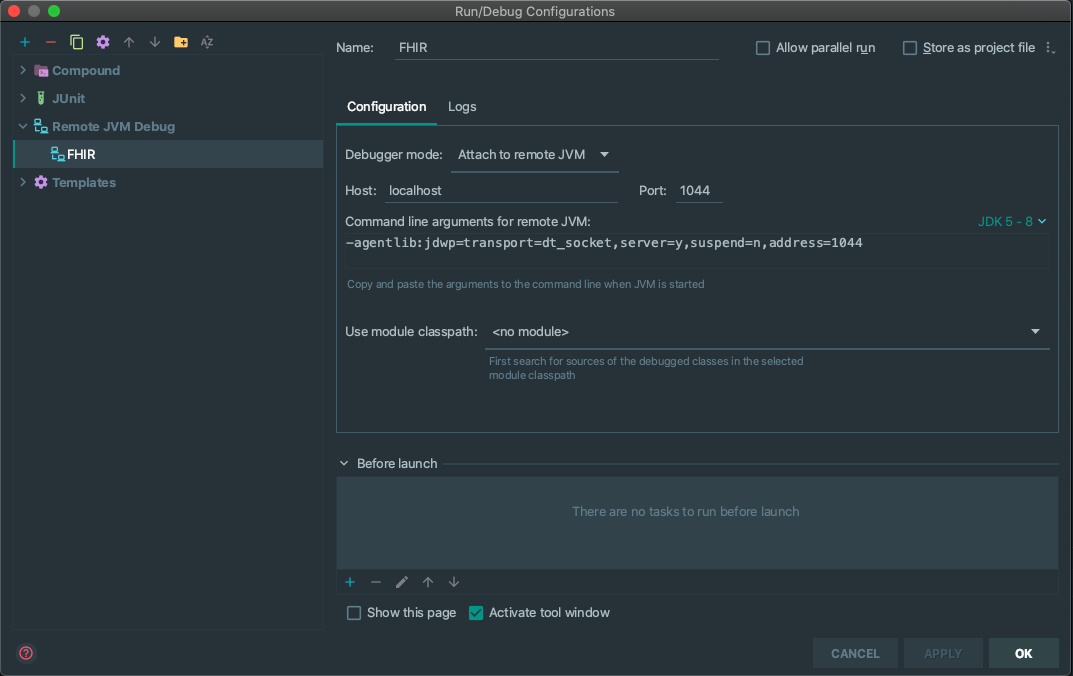
To be a bit more concrete about this, I primarily use IntelliJ, so, unfortunately, I’m not as knowledgable about Eclipse, but one of the things I work on is the FHIR module and have a test instance that I use to debug. I actually have several different projects that are all setup to point to this one instance. So, when I have the FHIR2 module open, my IDE uses this configuration:
But I’ve also need to step through code in core, so my copy of openmrs-core also has this configuration:
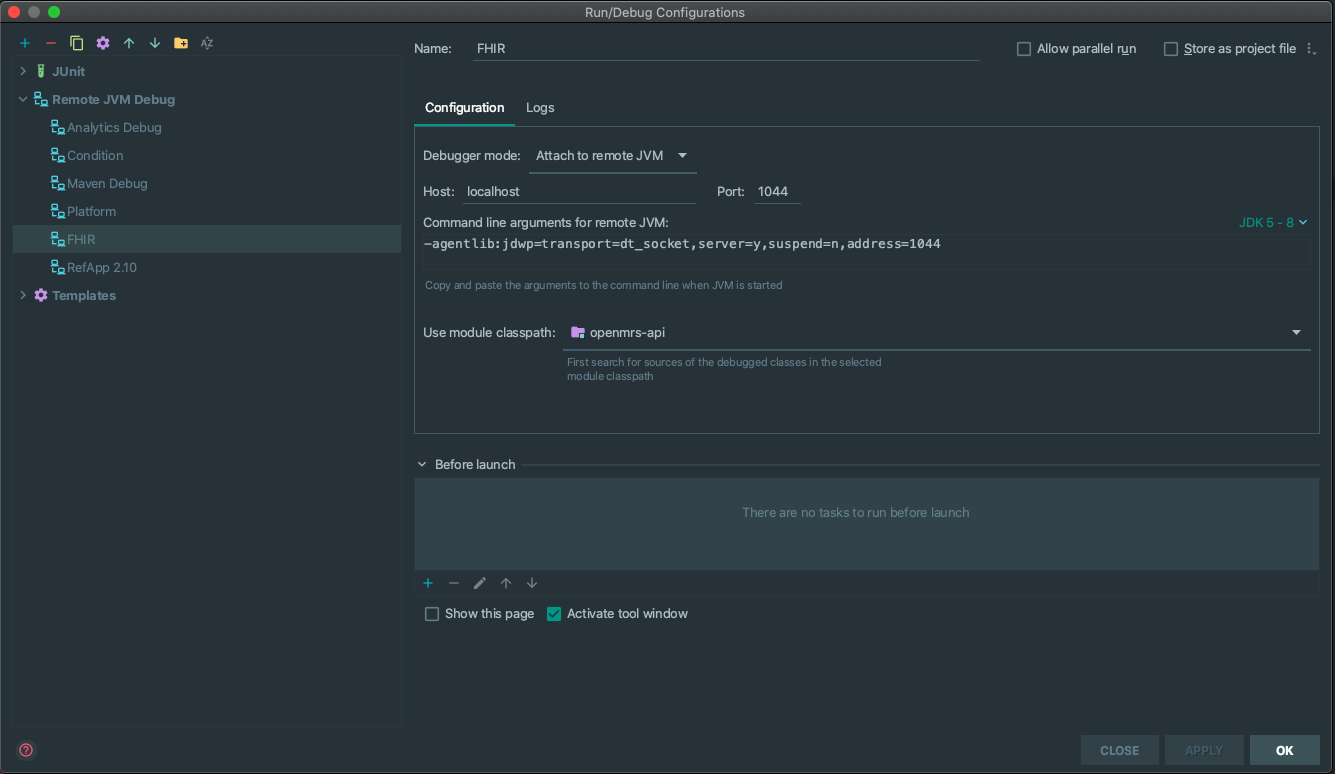
(You can see I’ve actually connected from my OpenMRS core project to several SDK instances). The important detail is that your IDE has the source code for the module you want to debug open in it… otherwise, it’s very hard to properly set breakpoints (which, again, only exist for your IDE). Hope that helps!