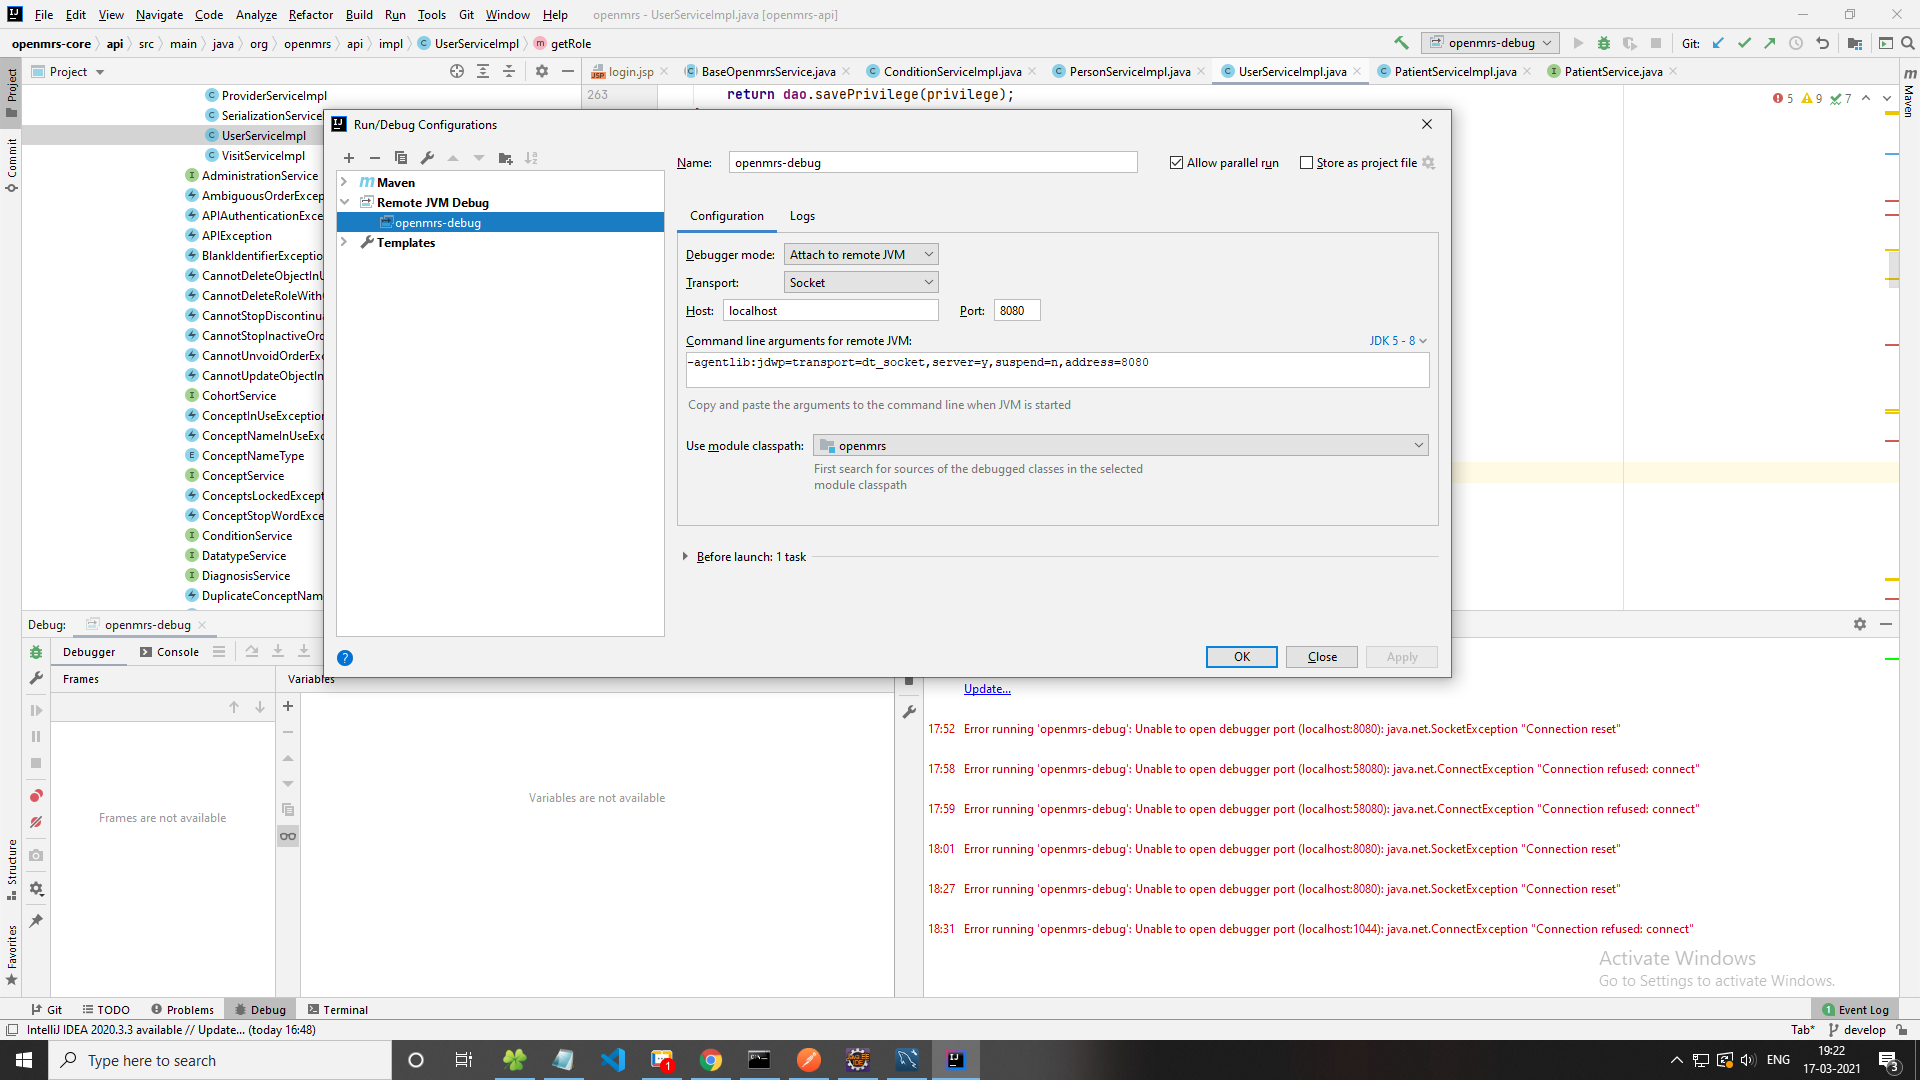
mvnDebug jetty:run is usually what I use. Note that you need to connect to the remote JVM via the JVM debug port, not the web port (8080). If you use mvnDebug command, this will be port 8000.
It’s basically the same process. You’d just be connecting to it from an IDE project with the module in question open. If you want to debug a module deployed to an SDK instance, you need to use a command like mvnDebug openmrs-sdk:run -DserverId=<server> -Dfork=false. If you want to debug a module in Jetty, you need to deploy it to the modules subfolder of the main OpenMRS folder (creating it if necessary). On Windows, this should be %APPDATA%\OpenMRS.
So you mean that i have to add breakpoints in the attachment module’s source code where i want to debug, then need to make omod from attachment module’s source code and then need to deploy it on the modules folder ?
Currently I’m adding breakpoints in attachment module’s source code then making omod from that and deploying it to modules folder and running openmrs-core with mvnDebug jetty:run
but I’m not able to debug the module.
So am i doing right or i need to follow some other steps ?
Well, break-points don’t exist in code. They are entirely a fiction of your IDE, and that’s the important part.
What you need to do is deploy the OMOD to the modules file, as you are doing, run mvnDebug jetty:run, but then ensure that your IDE has the attachments module project open and that it’s from that window that you connect the debugger to the OpenMRS instance.
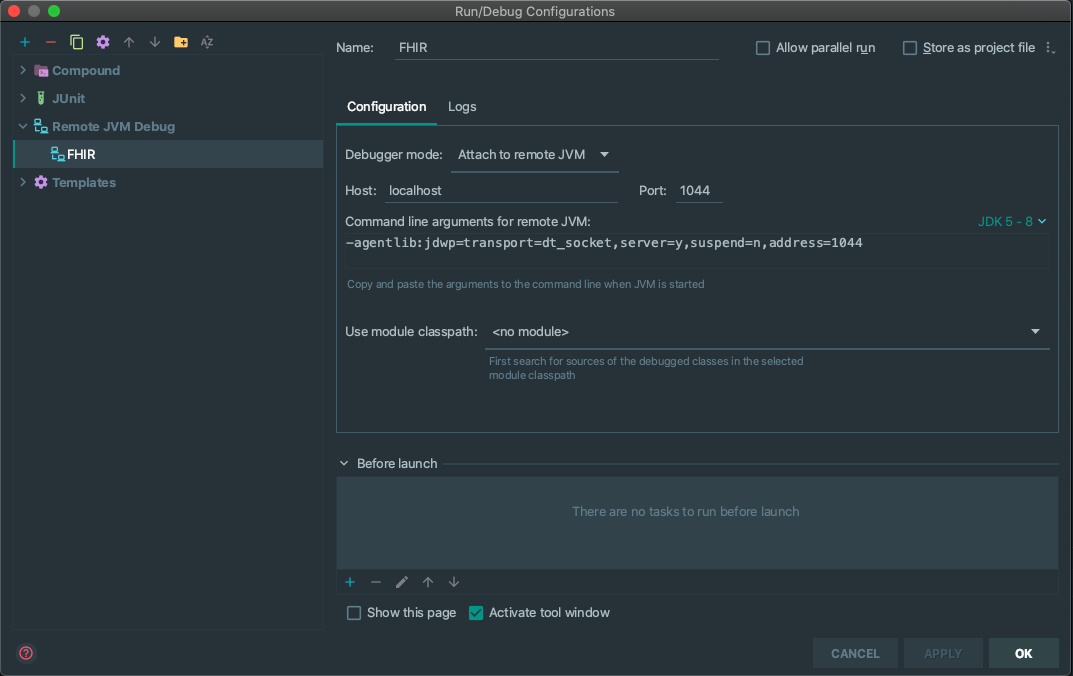
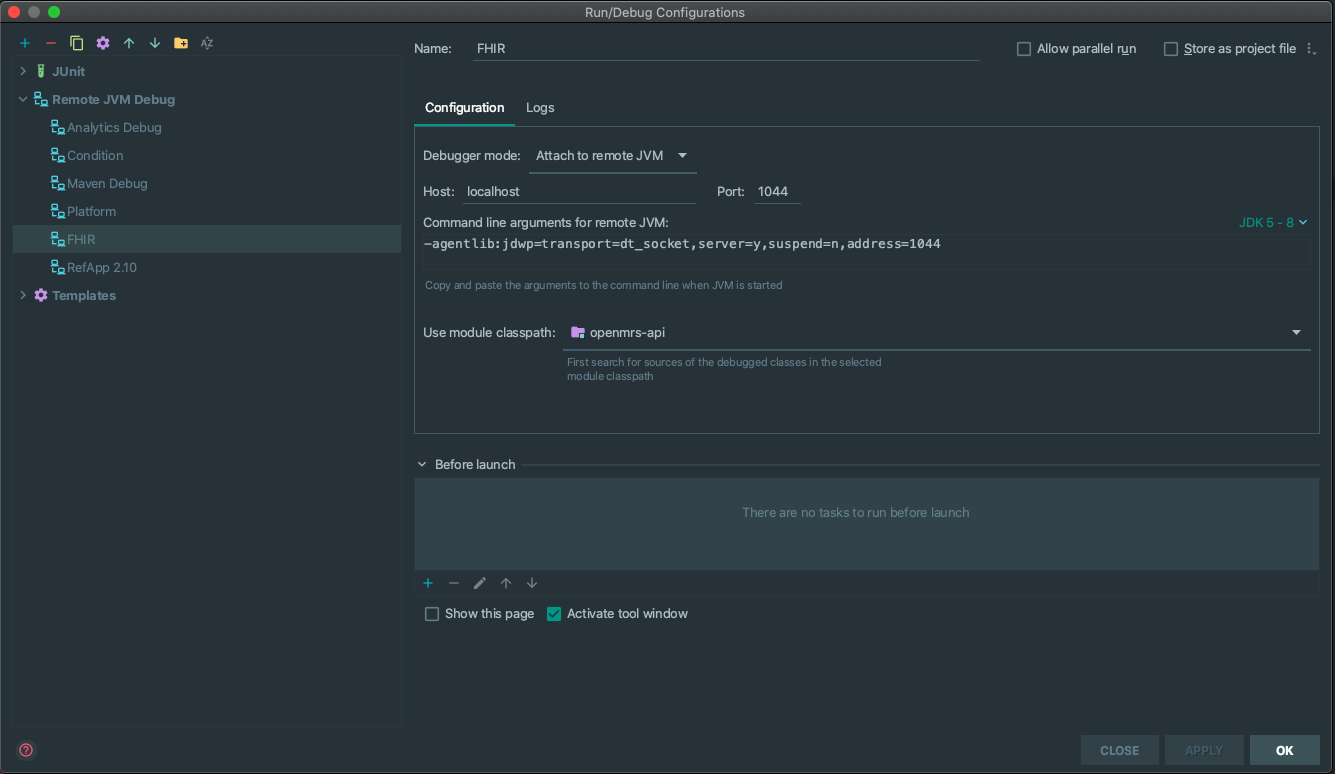
To be a bit more concrete about this, I primarily use IntelliJ, so, unfortunately, I’m not as knowledgable about Eclipse, but one of the things I work on is the FHIR module and have a test instance that I use to debug. I actually have several different projects that are all setup to point to this one instance. So, when I have the FHIR2 module open, my IDE uses this configuration:
(You can see I’ve actually connected from my OpenMRS core project to several SDK instances). The important detail is that your IDE has the source code for the module you want to debug open in it… otherwise, it’s very hard to properly set breakpoints (which, again, only exist for your IDE). Hope that helps!
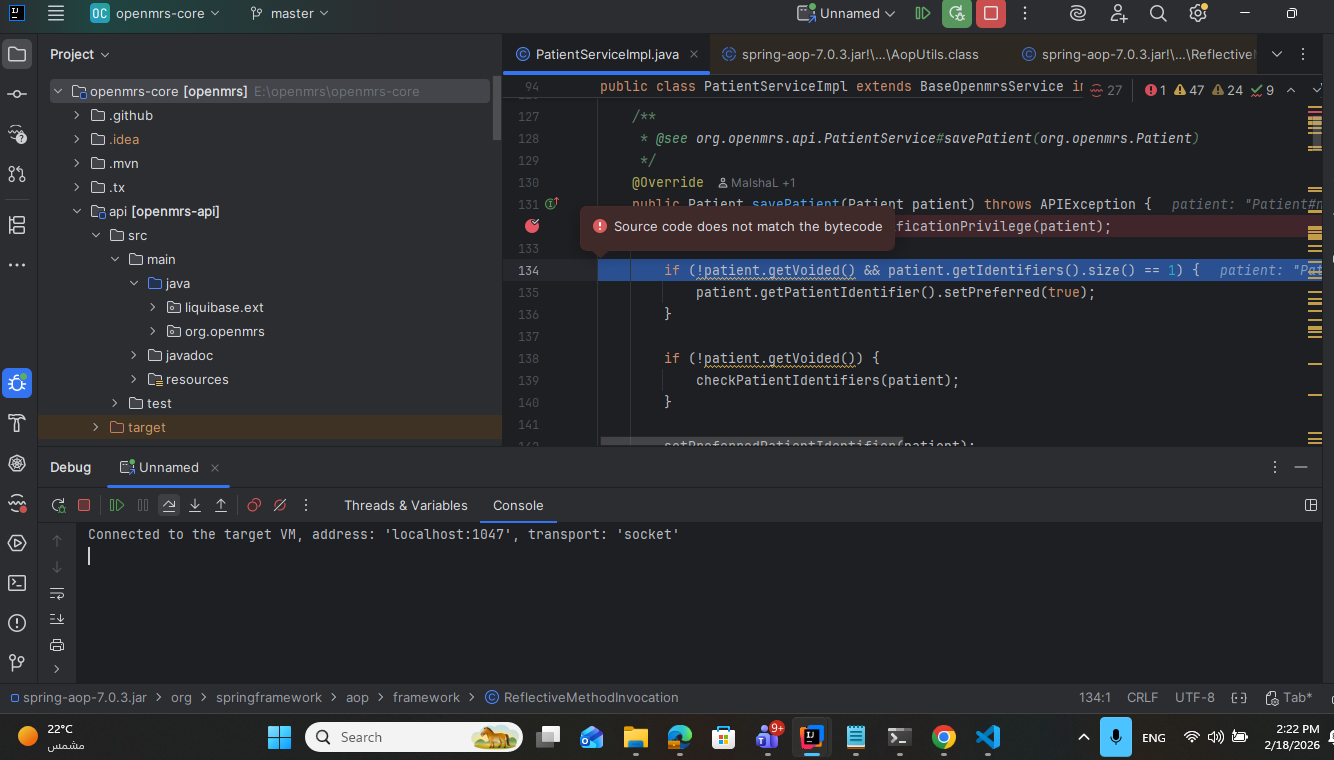
That message happens when the code you are running is a different version from the code you have in your IDE. Make sure you have the tag corresponding to whatever version of OpenMRS Core you’re debugging against.
Every released version of core has a corresponding tag, so you checkout the Git tag that corresponds to the version of core you’re running. If core is running a snapshot, checkout the related branch (e.g., 2.8.x).
I am running sdk Reference Application 3.x version 3.5.0 , and I have latest code from the openmrs-core project , how can make sure ,when I debug the openmrs-core project, I do not get this mismatch version error message ? Should I pull openmrs-core code from another place ? thanks for help.
So in your SDK setup, there’s a file called openmrs-distro.properties which should have a war.openmrs line that tells you what version of OpenMRS core it’s run with. Or you could check the release notes.
 , I was looking for this solution from a long time. It’s working.