🎯 GSoC Starter Challenge: Dependency Vulnerability Dashboard

Hey GSoC students,

As you keep exploring ways to contribute to OpenMRS and get comfortable with the codebase, here’s a fun starter challenge for you.

This isn’t just practice work. :wink: It’s a real feature that will go live and be used by the community. Think of it as a hands-on way to demonstrate how you approach data, logic, and clean UI design while contributing something meaningful.

  • You are given 3 JSON files (one per repository).
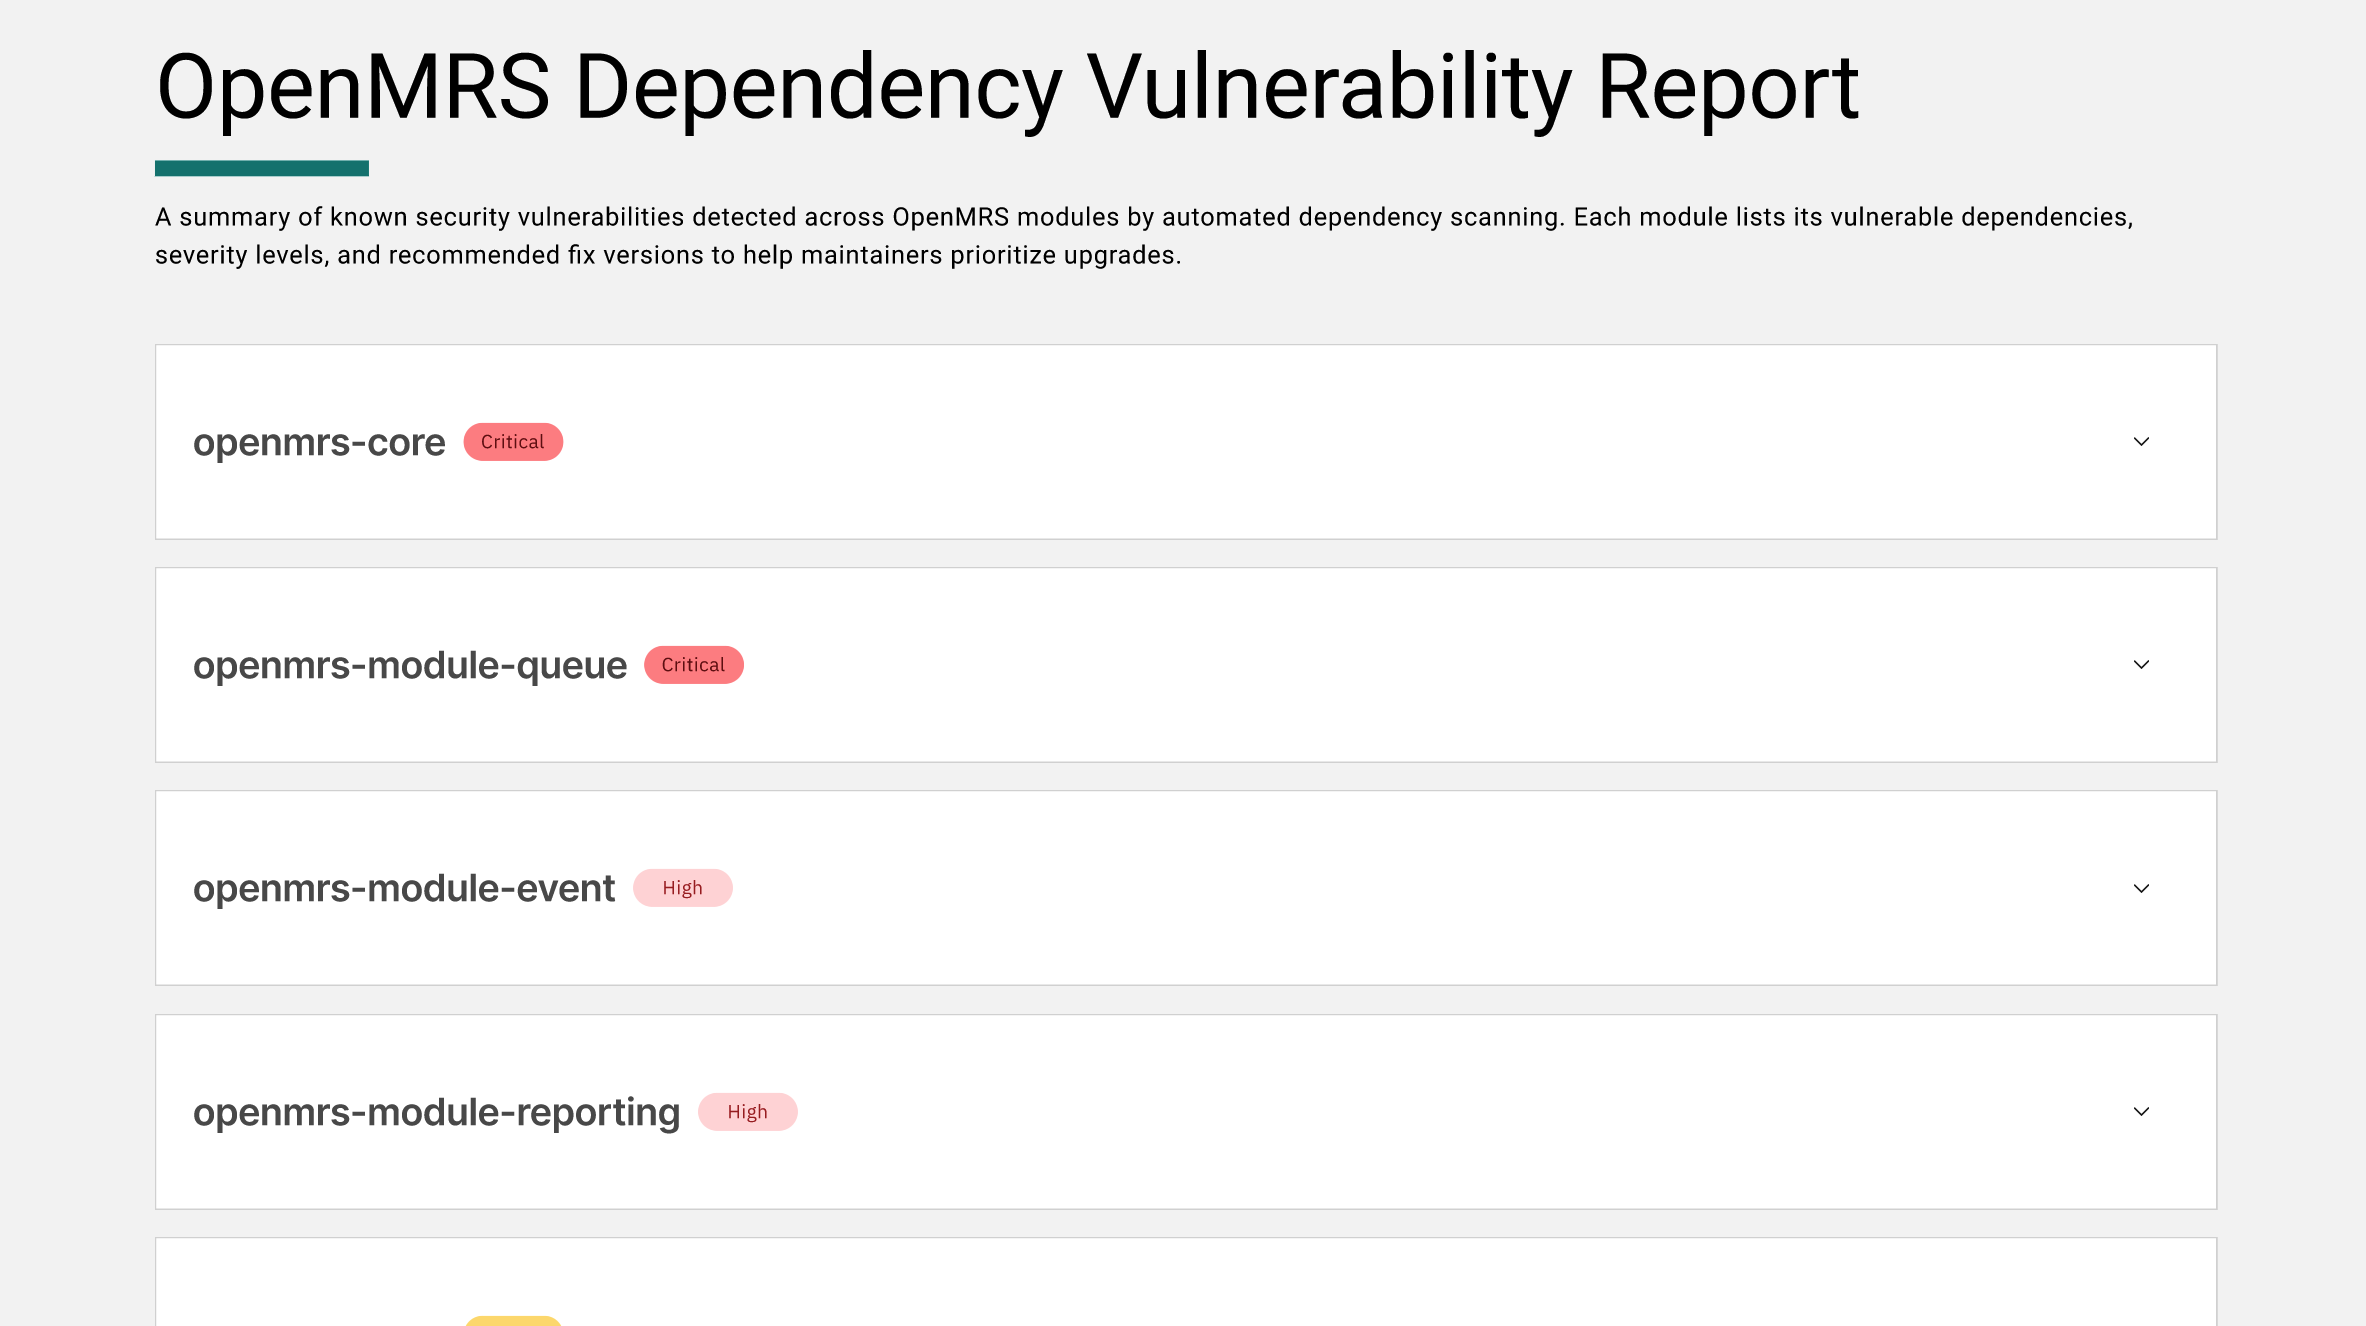
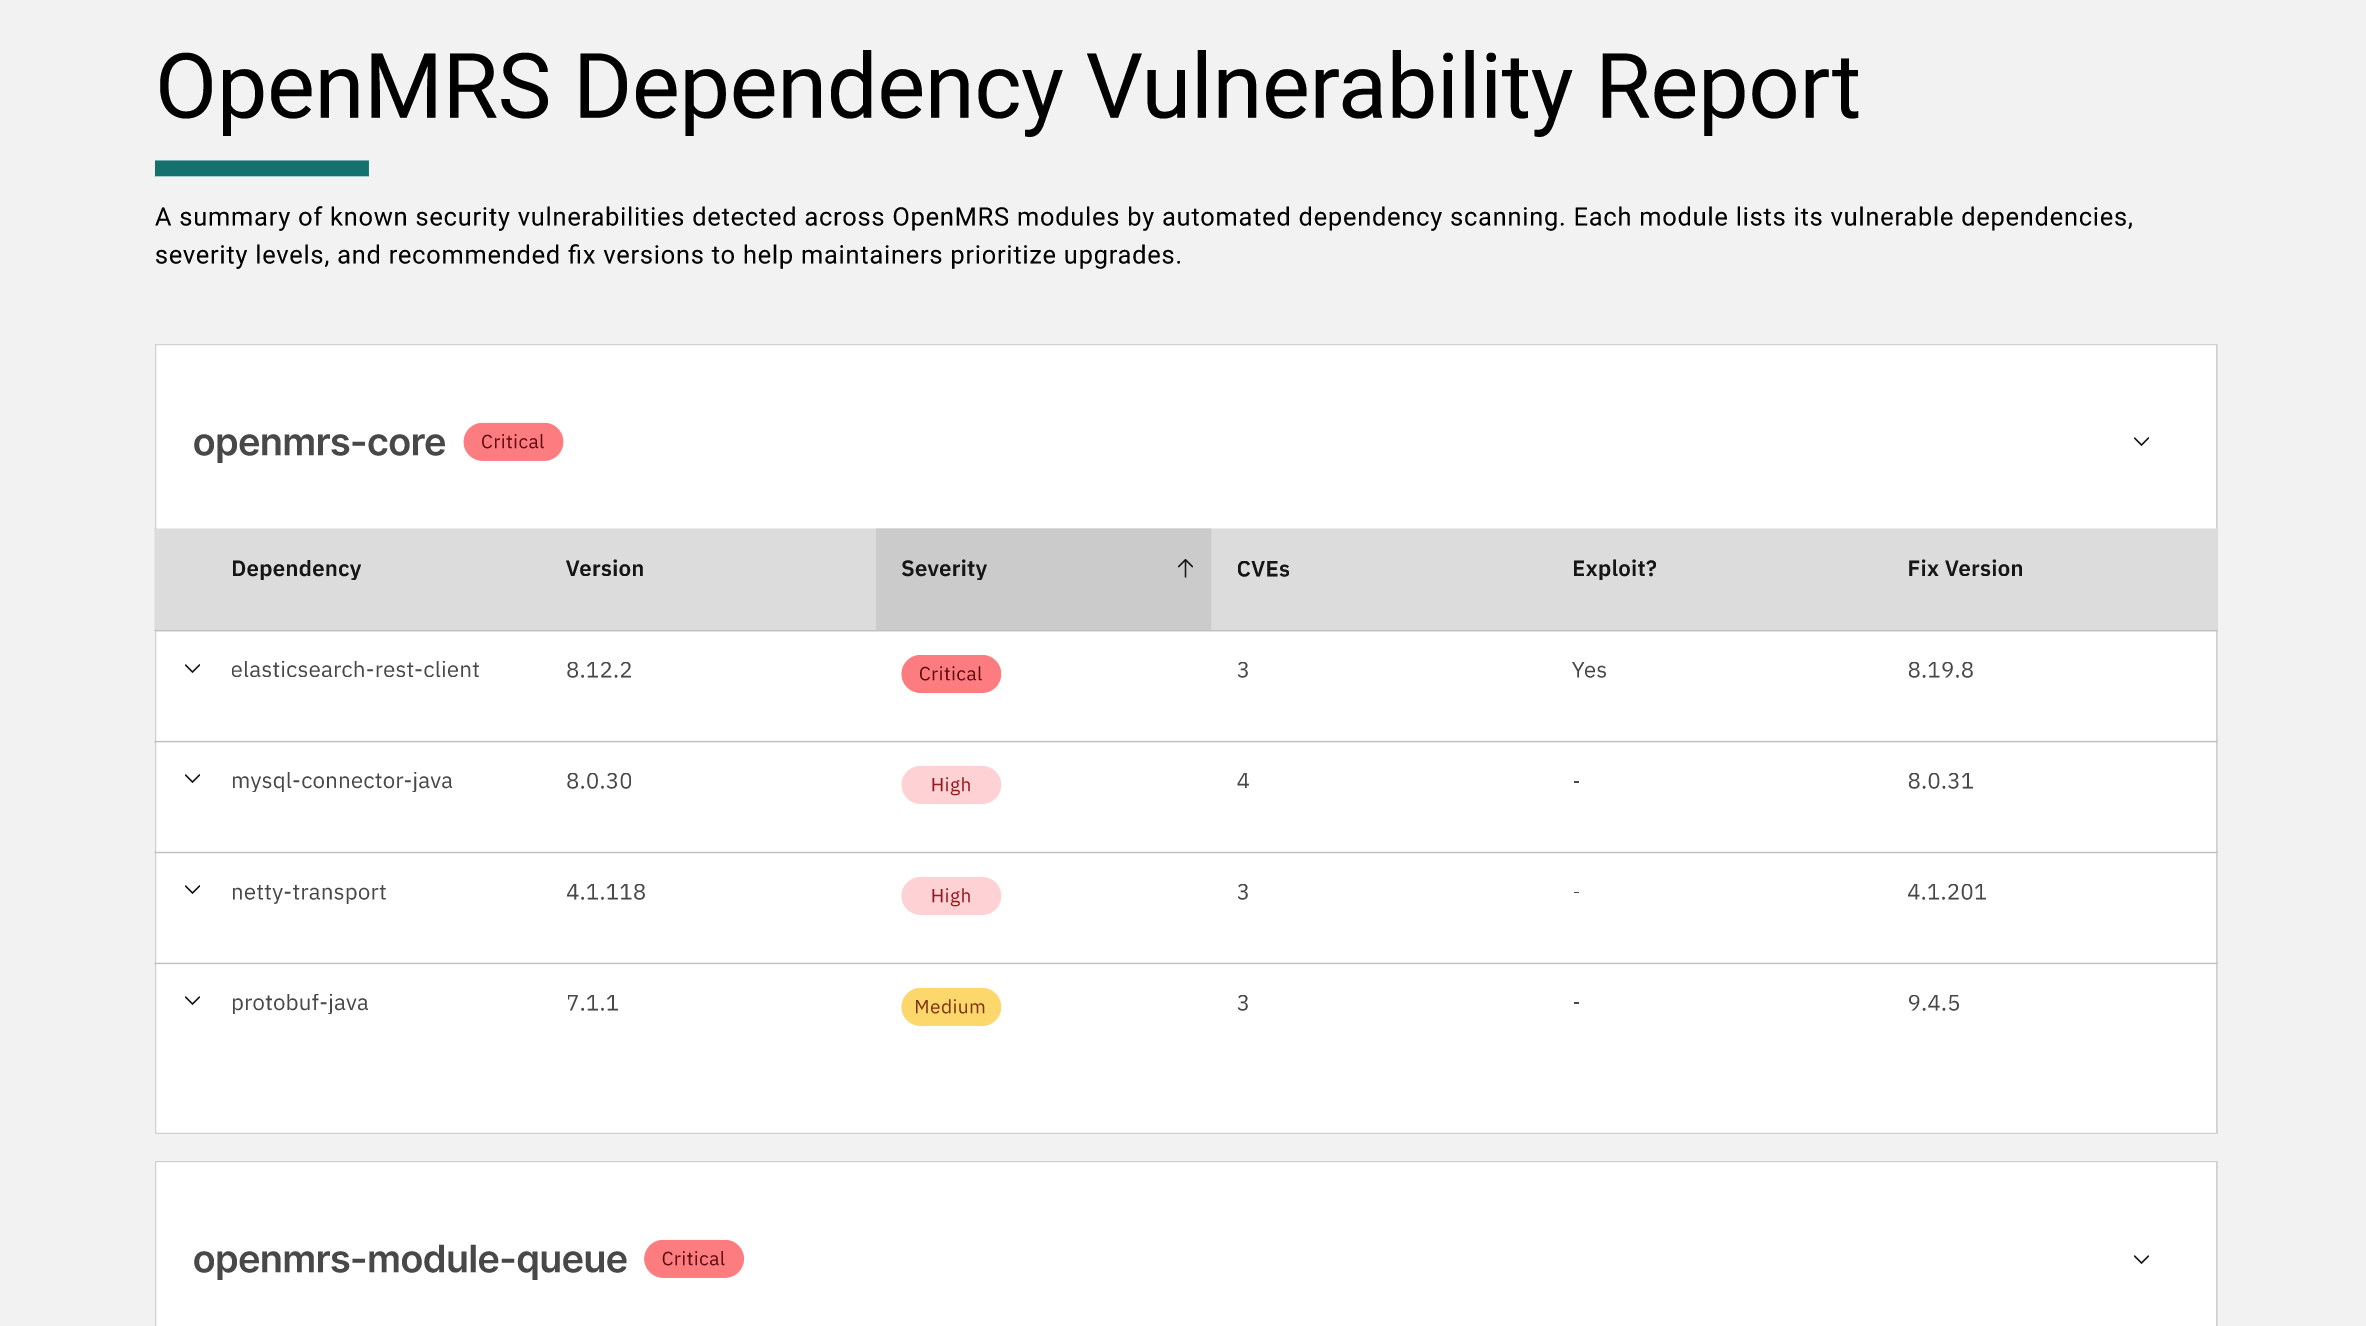
  • Your task is to build the dashboard shown in the mockup and render the report dynamically from those JSON files.
  • No backend required.
  • Mockup
  • Repository

:brain: Core Logic

CVEs

Sort by: Score (descending)

Dependencies

  • Dependency severity = highest CVE severity (by score)
  • Fix Version = highest “fixedIn” version that fixes all CVEs
  • Sort by:
    1. Dependency severity
    2. Highest CVE score
    3. Name (A–Z)

Repositories

  • Repo severity = highest CVE severity in that repo
  • Sort repos by:
    1. Repo severity
    2. Highest CVE score in repo
    3. Repo name

:desktop_computer: UI Expectations

Match the mockup:

  • Collapsible repo sections
  • Collapsible dependency rows
  • Severity pills
  • CVE detail table
  • Proper sorting everywhere

Submission

Fork the repo and send your PR to:

GitHub - jayasanka-sack/openmrs-contrib-dependancy-vulnerabilities (Will be moved to OpenMRS org soon.)

:glowing_star: Phase 2 (Optional / Go Beyond)

If you’d like to go beyond the initial scope, here’s an exciting extension.

The JSON files you were given are based on GitHub Actions artifacts (for example: a run like openmrs-module-billing/actions/runs/22481757742Artifacts > dependency report).

Instead of relying only on the static files provided, try to implement logic that fetches the latest report from the main branch automatically.

This makes your solution more dynamic and closer to production usage.

Notes

  • The initial phase (static JSON-based dashboard) is expected to be completed by 2026-03-04T18:30:00Z.
  • Keep it minimal and simple, and readable. Pretend a teammate will maintain it next month.
  • If something in the JSON is missing, handle it gracefully (show -).
  • . This is a relatively small dashboard page, so even plain HTML/CSS/JS would be enough. No need to over engineer it unless you really want to explore. Using multiple frameworks just to render a simple set of tables would be unnecessary.
9 Likes

i’ve some doubts regarding to this listed below :

  • is it necessary to use carbon design system ?
  • is it compulsory to make the design pixel-perfect just like mockup ?
  • should we have to follow some particular architecture for this ?
  • I’ve looked data files but I’m unable to get:
    • Fix Version for dependency
    • CWE in cves
    • Affected Versions in cves
    • Fixed In in cves
    • also i computed score using below is it what required ? :
      • 
        export const severityScoreMap: Record<NormalizedSeverity, number> = {
          critical: 9,
          high: 7,
          medium: 5,
          low: 3,
        };       
        
      • score: severityScoreMap[normalized]
        

Thank you in advance for help looking forward to complete this before deadline :slight_smile:

1 Like

hi @jayasanka thanks for giving this amazing challenge. I’ll raise the PR before deadline

1 Like

Great questions @harpalll!

no

It would be better to match the mockup. not pixel by pixel, but close enough.

No. you are free to come up with your own. The simpler the better.

Please check files inside dependency report (for example: a run like openmrs-module-billing/actions/runs/22481757742Artifacts > dependency report ) to check if you can find any missing fields.

If something in the JSON is missing, handle it gracefully by showing - .

Score should not be calculated and should be fetched from the report artifacts. Leave blank if it is not available.

1 Like

hey @jayasanka, i’m using typescript, vite and tailwind to build this. is this okay?? or do i use scss or something else??

Hey @pgdev!

You’re welcome to use your own stack, that’s totally fine.

That said, I’d recommend keeping it minimal and simple. This is a relatively small dashboard page, so even plain HTML/CSS/JS would be enough. No need to over engineer it unless you really want to explore.

thank you very much for clearing the doubts, I’ll soon raise a pr for this.

thank you @jayasanka.

okii thank you for the help

as openmrs uses carbon design system and scss ,using it will make you more familiar with the codebase

1 Like

ya thought the same and used it also ill link the pr here soon can you review ?

@jayasanka hi just raised a pr, I would really appreciate it if you could take a look when you have time, thank you !

1 Like

@jayasanka does this challenge include those aspiring to apply to backend projects like java /spring-related?

Regarding AI assistant usage questions in my DMs, you’re free to use any tools or technologies you’re comfortable with. If you think you need a particle accelerator to build a wormhole, go for it. Only you truly know how your wormhole works :wink:

That said, please don’t send these as DMs. Post your questions here in the thread so everyone can see, learn, and benefit from the discussion.

This is just an optional activity. Anyone can participate regardless of the project they plan to apply for.

@jayasanka Hey, I see this more of a front-end challenge , Honestly I am more focused on the backend and I don’t want to vibe code the challenge because that will just deliver low quality work, can we have a backend challenge too? that will be greatly appreciated :slight_smile:

Hi @jayasanka just raised a PR, It’s my first contribution to OpenMRS. Took some references from peers and some AI help, But understood all and will look forward for more challenges and contribution.

Hi,

First of all, thank you so much for this opportunity. It was really fun working on this task, and I also tried my hand at completing Phase 2 as well. I’ve raised the PR here.

feat: Add openmrs dependency vulnerabilities dashboard by bhavya-jpg · Pull Request #10 · jayasanka-sack/openmrs-contrib-dependancy-vulnerabilities · GitHub

Please feel free to take a look whenever you have the time, and do let me know if you think any changes or improvements are needed. I really enjoyed working on this and I’m looking forward to contributing more and learning further through the GSoC process.

Thanks @jayasanka for this, since I am a backend aspiring dev, i had an idea to make an extended version for better development, since its explicitly mentioned that no backend is required here is my backend logic so if anyone else who are wondering how can we use a backed in this, though it can be done with simple frontend as we need to just sort and retrieve the data.

Since this starter task is frontend-only, I implemented the dashboard using the provided static JSON files on the client side. For an extended/production-style version, I’m planning to add a Spring Boot backend with PostgreSQL to persist and expose the vulnerability data.

Rough backend design I have in mind:

Models (JPA entities / DTOs):

Repository (id, name, severity, highestCveScore, etc.)

Dependency (id, name, severity, fixVersion, repo reference, etc.)

Cve (id, cveId, score, severity, description, affectedDependency reference, etc.)

Repository layer: Spring Data JPA repositories for these entities (RepositoryRepository, DependencyRepository, CveRepository) to store data in PostgreSQL.

Service layer:

A service that loads/parses the GitHub-generated JSON reports, computes repo/dependency/CVE severities according to the rules in this thread, and saves/updates them in the database.

A read service that exposes pre-aggregated data to the frontend (e.g., list of repos with severity, dependencies per repo, global CVE list).

REST API layer:

GET /api/repos → repo list with computed severity and top CVE score.

GET /api/repos/{id}/dependencies → dependencies for a repo with severity and fixVersion.

GET /api/cves → CVE list sorted by score (for the CVE view).

The current dashboard would then call these endpoints instead of reading static JSON directly, while still following the same sorting and aggregation logic defined in the challenge. Happy to get feedback if this aligns with how you’d envision a backend for Phase 2 or future extensions.

Hello @jayasanka

Thank you for the opportunity. I’ve completed the starter challenge and submitted my implementation.

PR: https://github.com/jayasanka-sack/openmrs-contrib-dependancy-vulnerabilities/pull/17

I tried to follow the requirements from the mockup and implemented the dashboard using the provided JSON reports with collapsible repository and dependency sections, sorting logic, and severity summaries.

Please let me know if any changes or improvements are needed. I’d be happy to update the implementation.

Looking forward to contributing more and learning through this process.

Though I am late to the party, I am currently working on the dashboard as requested. However, I noticed this feature may need eventual scaling, so I was wondering if there would be interest in also adding a Java backend that handles the JSON logic. I have already created the Java classes and would be able to trivially sort the Object/ArrayNodes. @jayasanka

VeryFriendlySolver