Logs from all services can now be found in a single place on a dedicated Grafana dashboard. You can quickly see error and warning counts, filter by services, list error logs, search etc.
Soon we will be adding alarms so you are notified about errors via e.g. e-mail. We are also planning to add metrics for monitoring your hardware utilisation so you can act when e.g. you are running out of storage.
The best part is that if you use docker-compose or OpenMRS Kubernetes helm chart, it’s extremely easy to deploy! Just copy over needed files or enable the feature in helm chart. No additional configuration needed. It comes with a pre-configured dashboard.
We welcome tweaks and improvements! If you make any changes in the dashboard, please do share them with the broader community so we can include them in the common setup and everyone can benefit!
Hey @raff! This is great! One thing: instead of using volume mounts to get the configuration into loki, alloy, and grafana containers is it possible to setup our own Dockerfiles to create those? This helps with getting things deployed in our weird infrastructure setup.
@ibacher good idea! I’m thinking of a small init container that has the whole config and copies it over to alloy, grafana and loki upon startup. It will make it super easy to distribute updates.
We’ve been using Grafana at @SolDevelo for our OpenLMIS implementations, and I think we have some configs that we could contribute here.
For instance, we built out a custom dashboard for endpoint health-checks (uptime, SSL cert expiration, etc.). It basically allowed us to ditch Pingdom for an entirely OSS stack.
Let me know if you think these would be a good fit for the O3 setup, we’d be happy to share them.
@raff Hi I have been working on developing the monitoring stack of OpenLMIS. I think the tool I have been using for probing the services might come in handy for OpenMRS monitoring service.
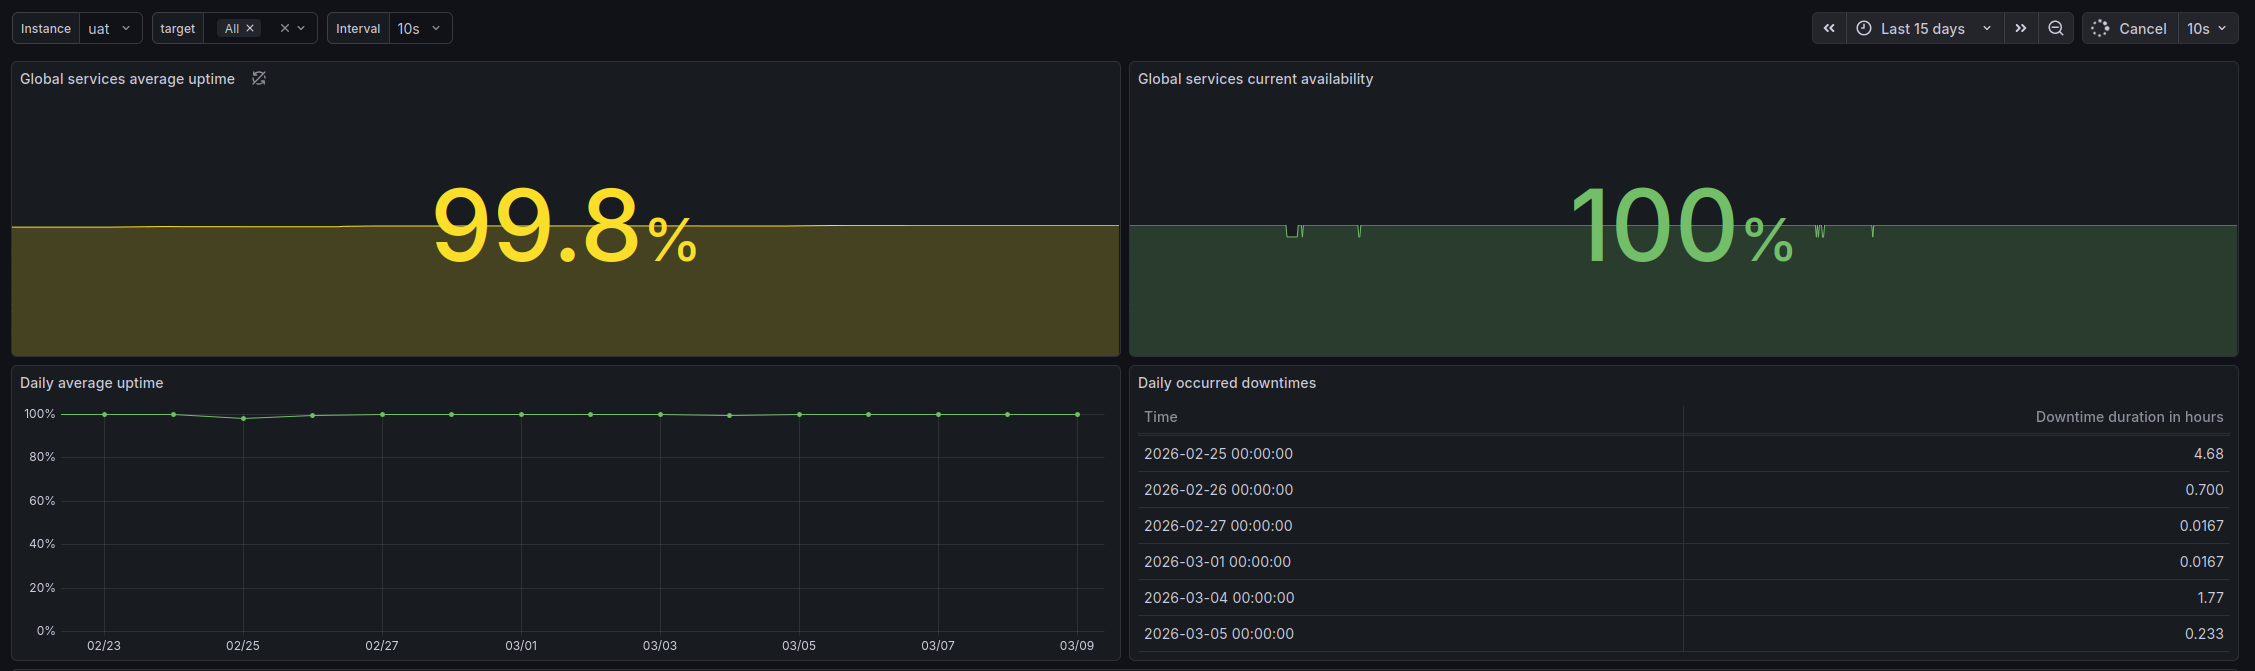
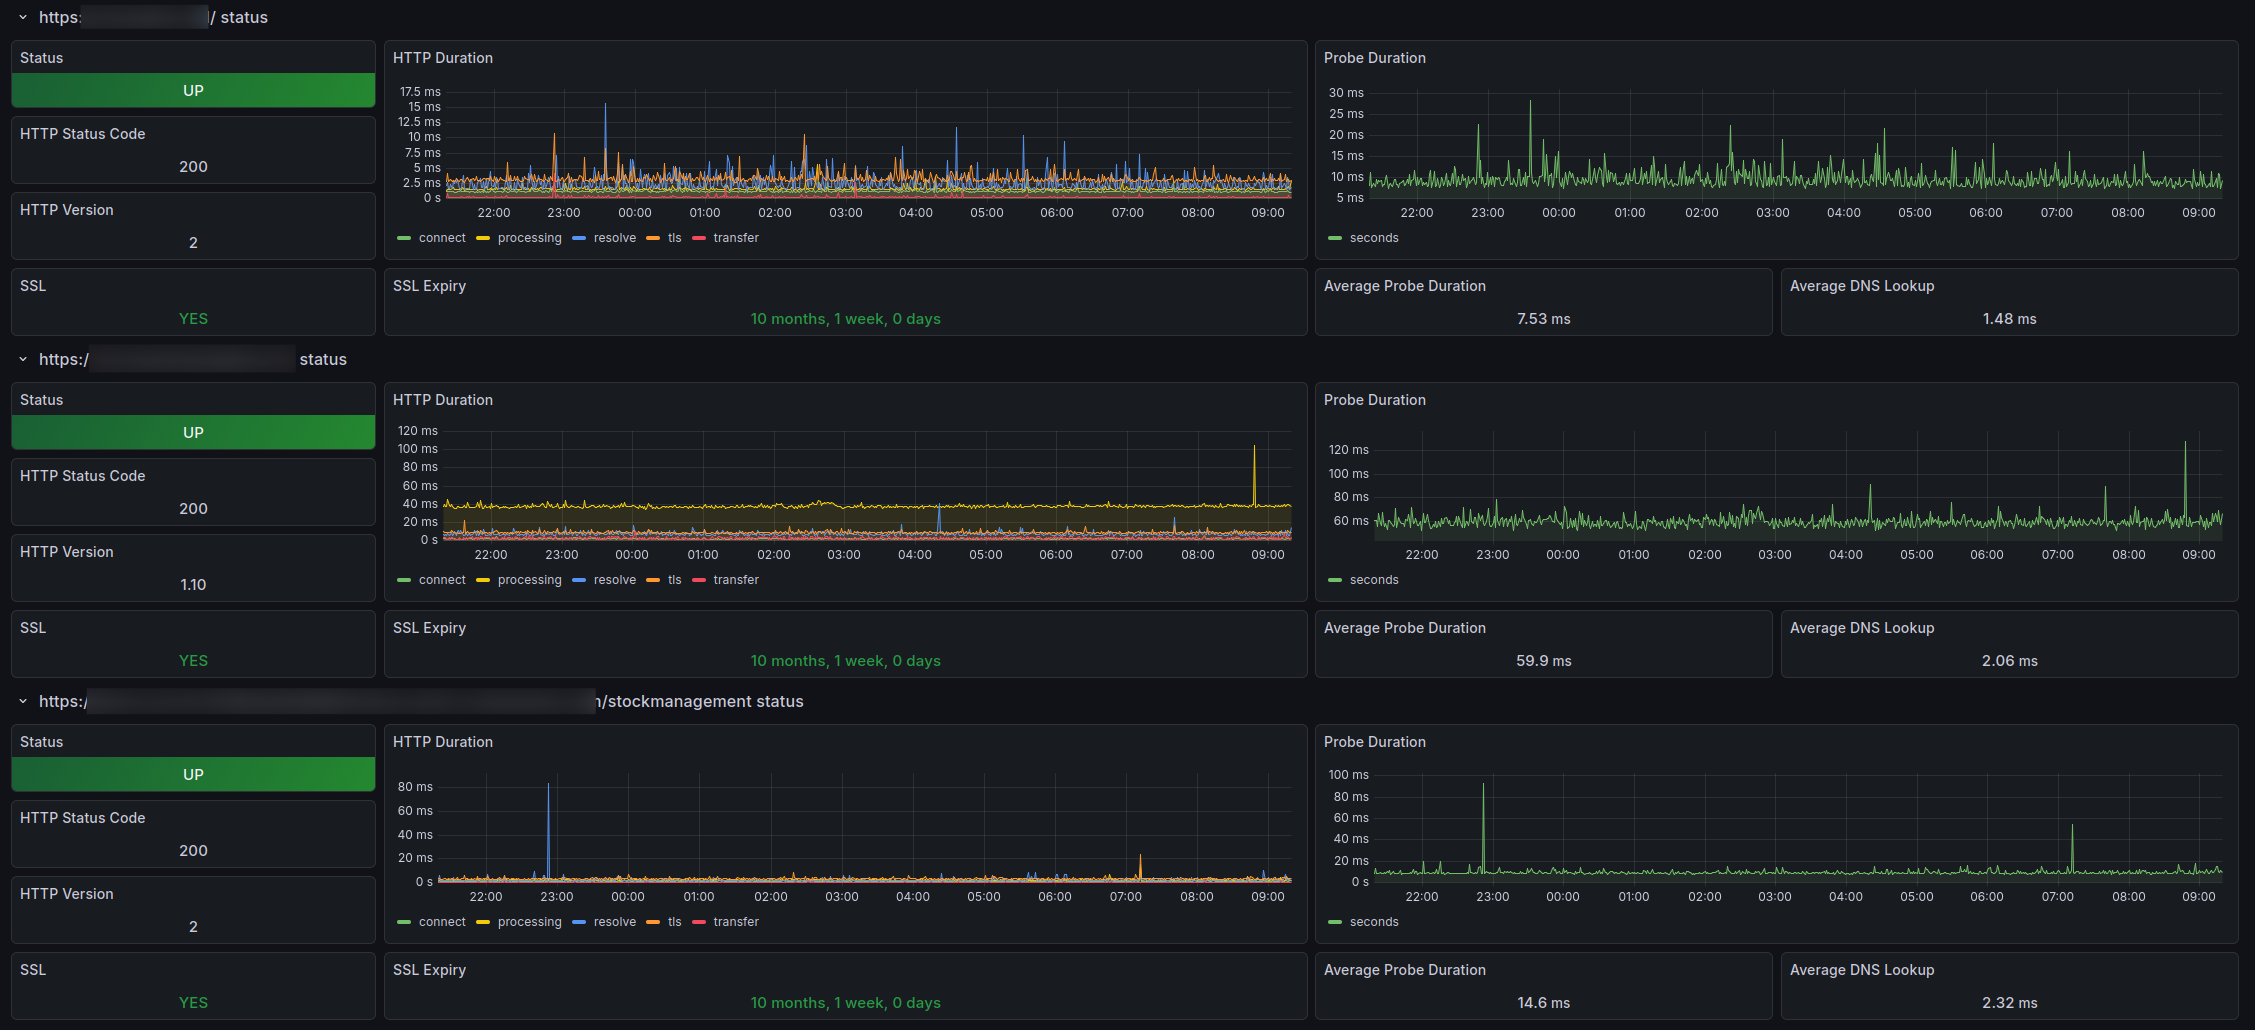
In OpenLMIS we are using it to test the endpoints availability, response time and connection details (which is base feature of the tool) but also as a way to preview the uptime and availability of instances as well as analyze occured downtimes. Take a look at some screenshot from running system below.
I have successfully configured the tool for OpenMRS and set up for probing backend and frontend of the app. For the deployments this tool can be configured to probe services directly, through load balancers and dns to be sure what part is misbehaving in case of any problems.