@eudson has an idea for @OHRI that’s been resonating with me: What if right on the Home Page / Clinic Dashboards, clinical users could immediately see a small snapshot of data important to them?
Here are some real-world production examples where OMRS Implementations have done this, and some design ideas from various teams below.
@jesplana you mentioned your team has set up something similar with SuperSet connected to your OMRS EMR - are you able to share a sample screenshot of what that’s looking like?
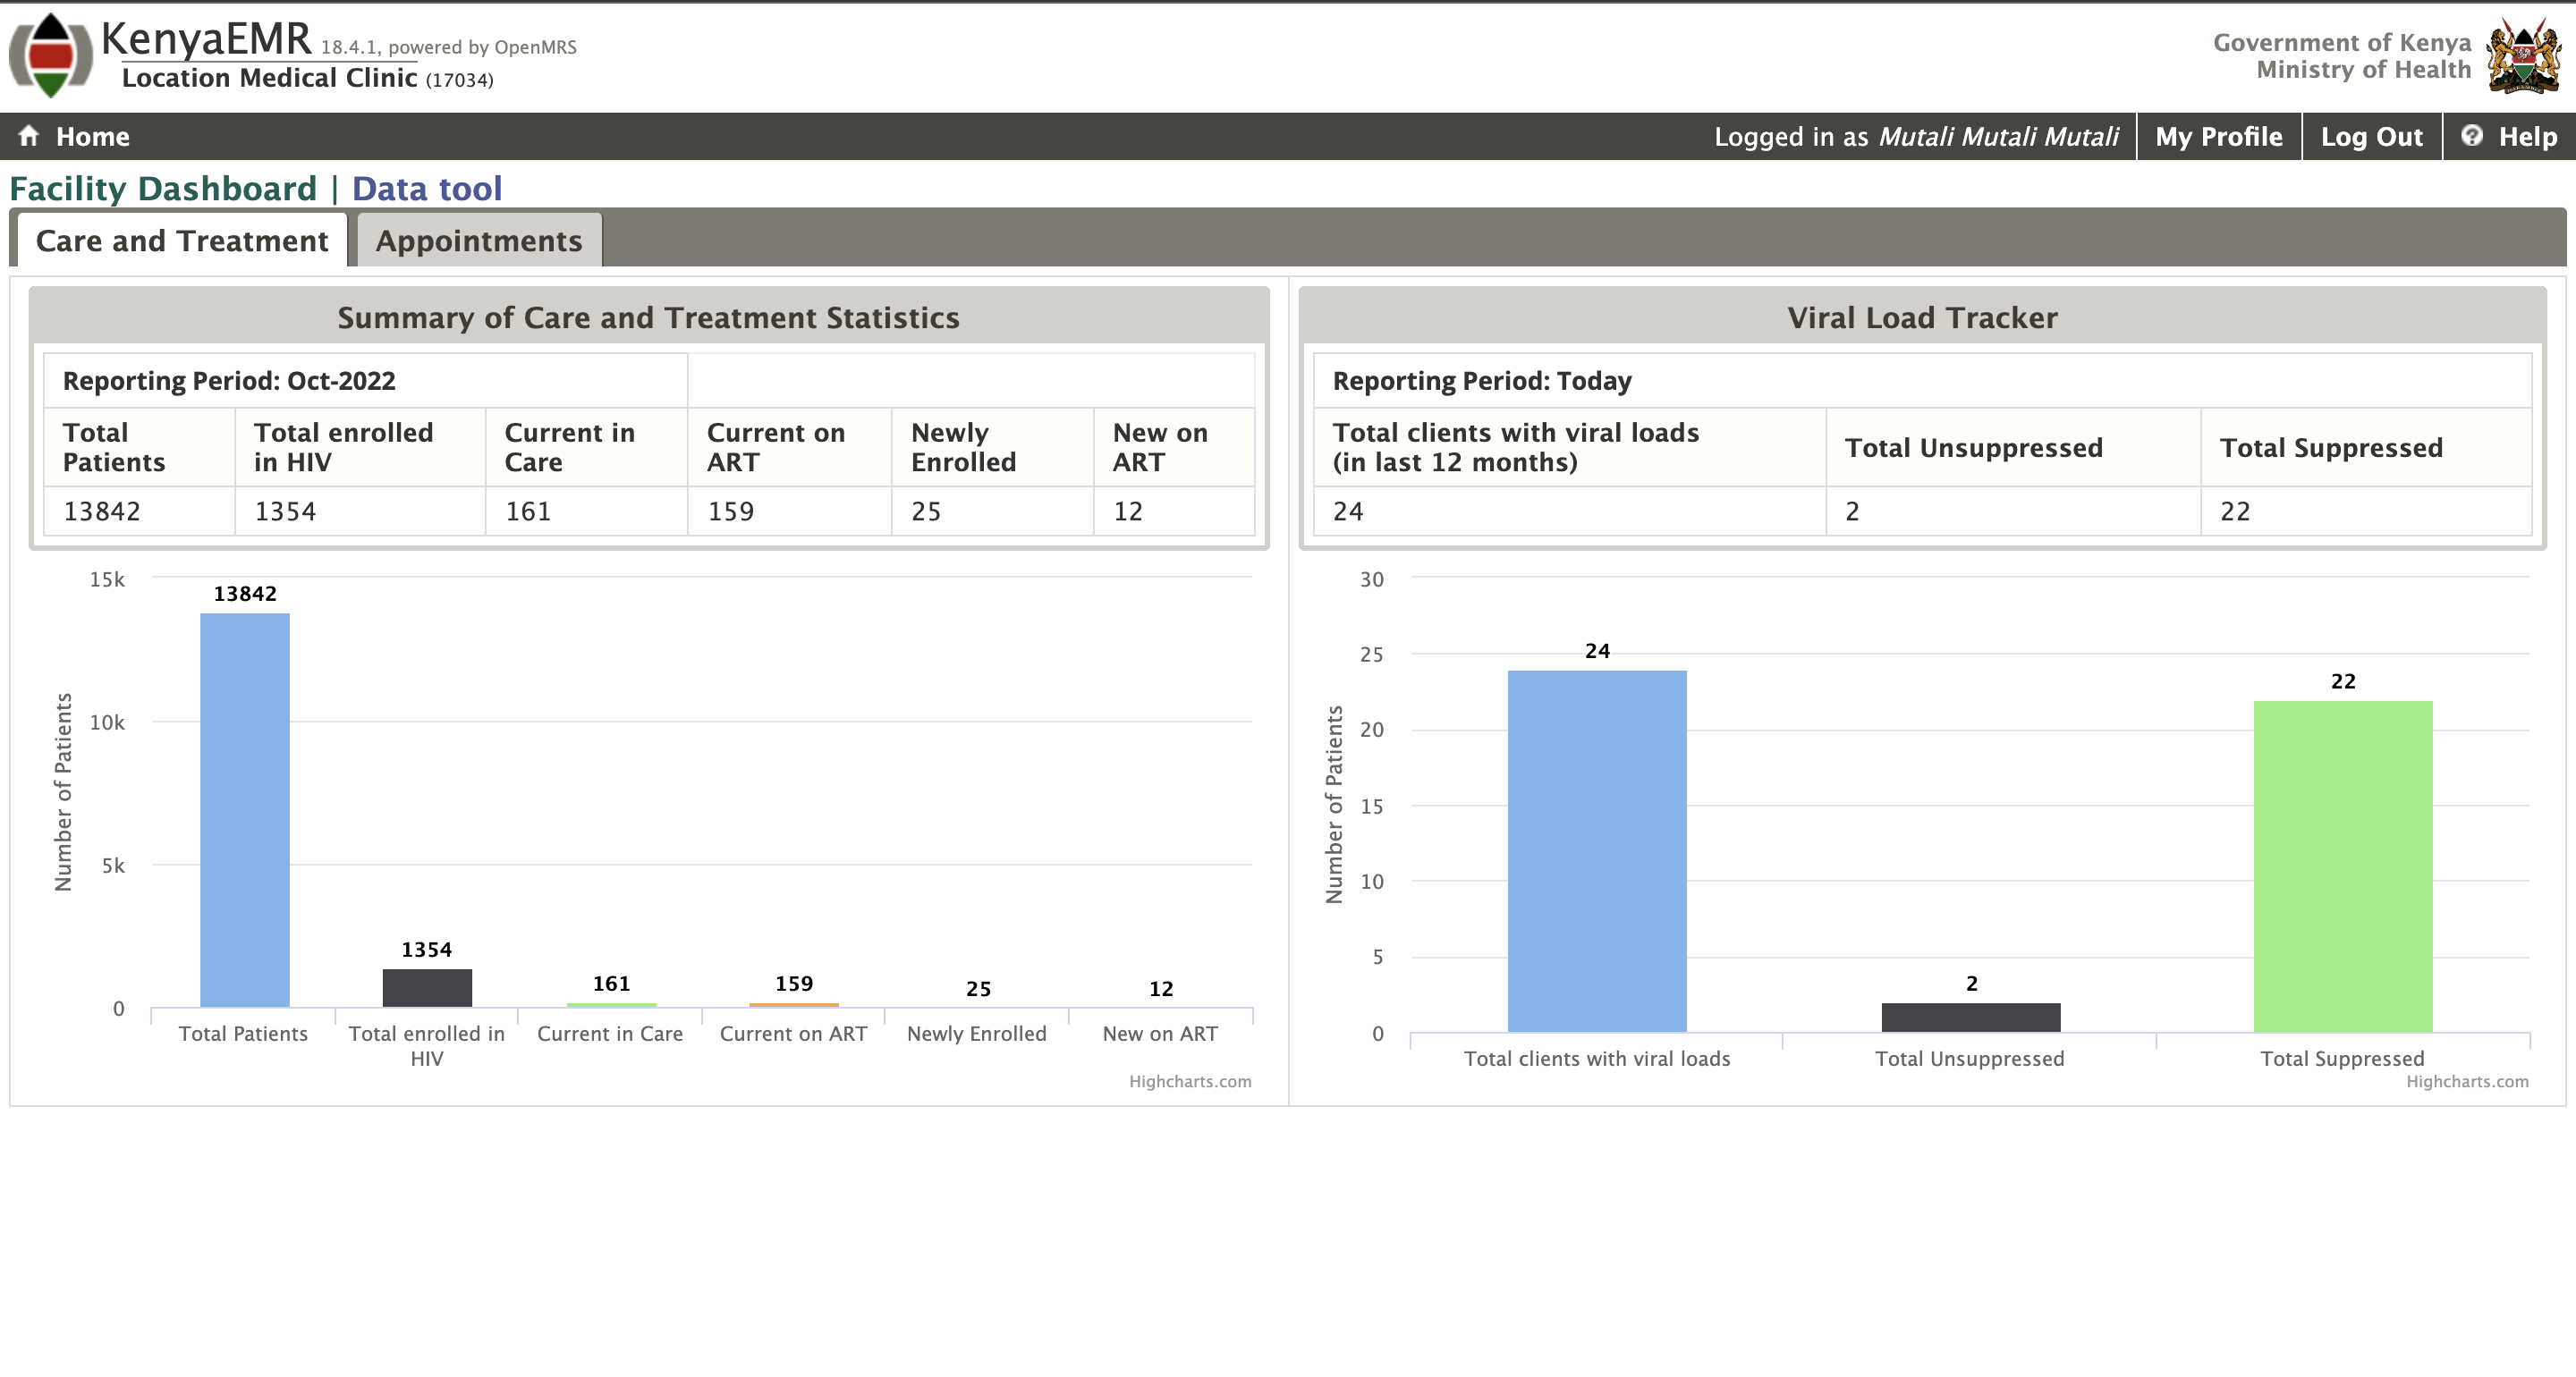
During site visits 2021-2022, especially to smaller, Publicly/MOH-funded sites, I noticed the clinicians really did reference this view; they looked at the 2 bar charts approx. daily to get a sense of their overall mission progress towards HIV suppression - especially the chart on the right.
Ampath Reports
(Many more sample screens and notes here: AMPATH EHR Data: Current & Future Capabilities — Gregory Schmidt)
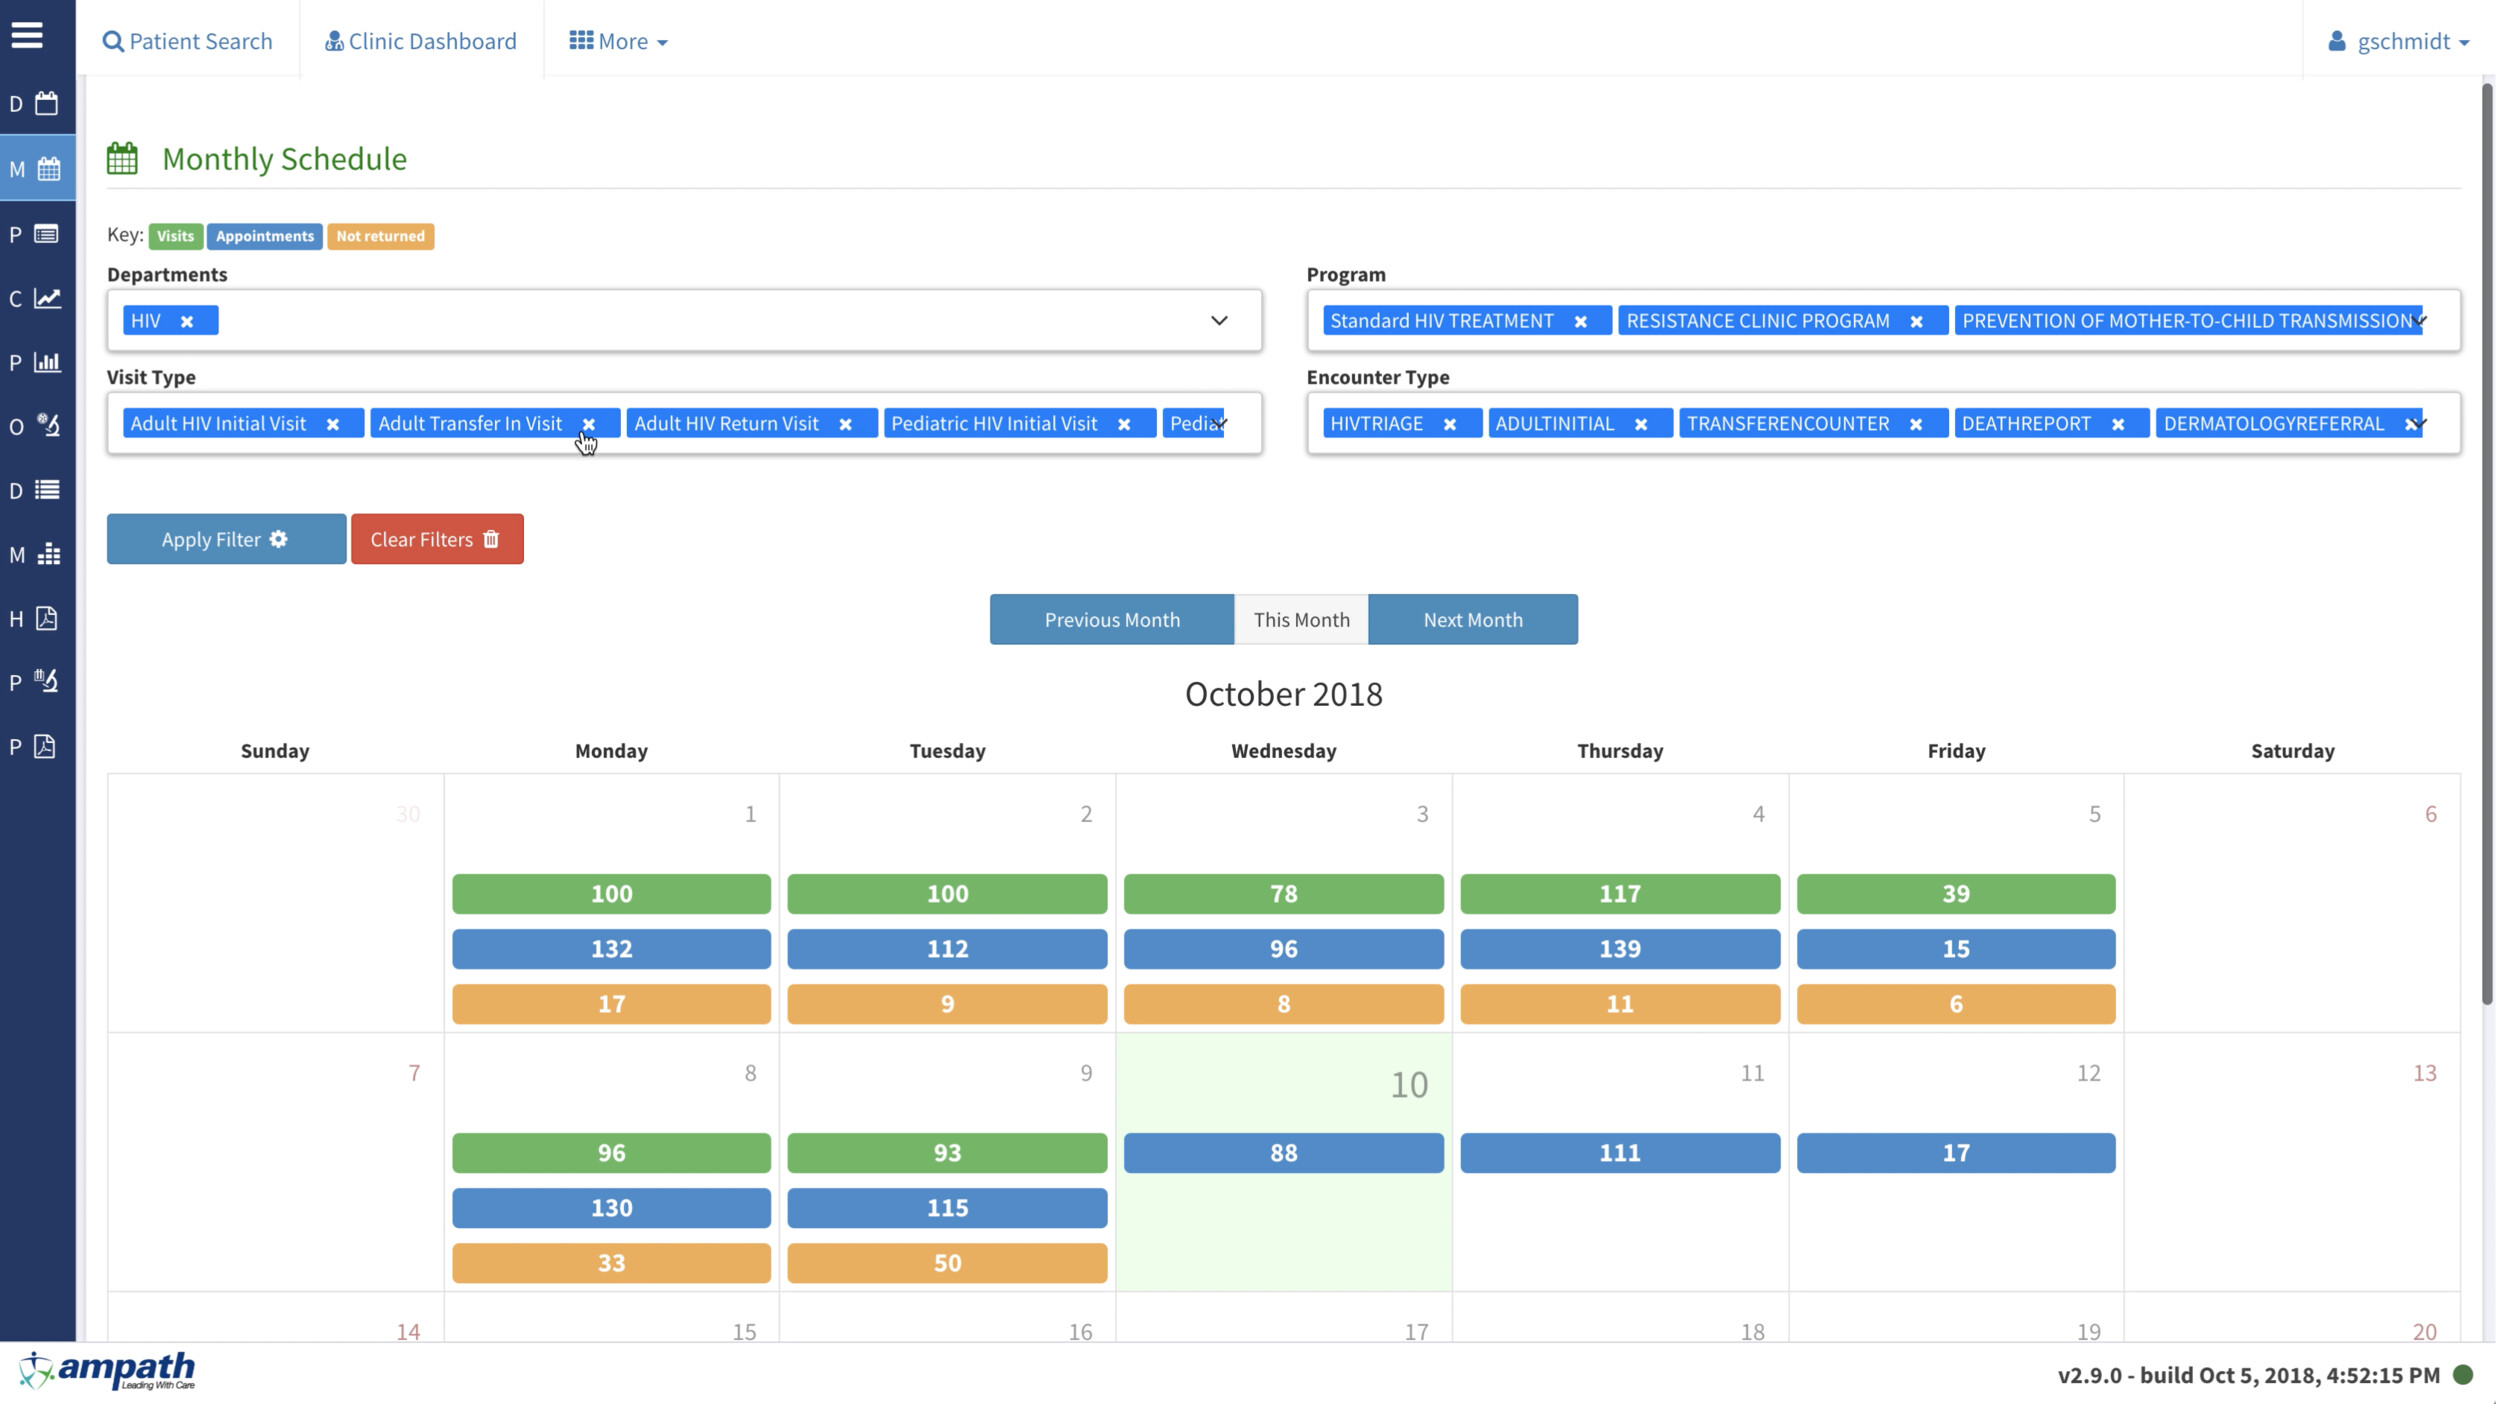
This isn’t quite the same as the KenyaEMR vision above, since these Clinic Visualizations are in their own tab in the AmpathEMR (not on like a home page / clinic Dashboard), but they’re noteable because I consistently saw clinicians looking at these views:
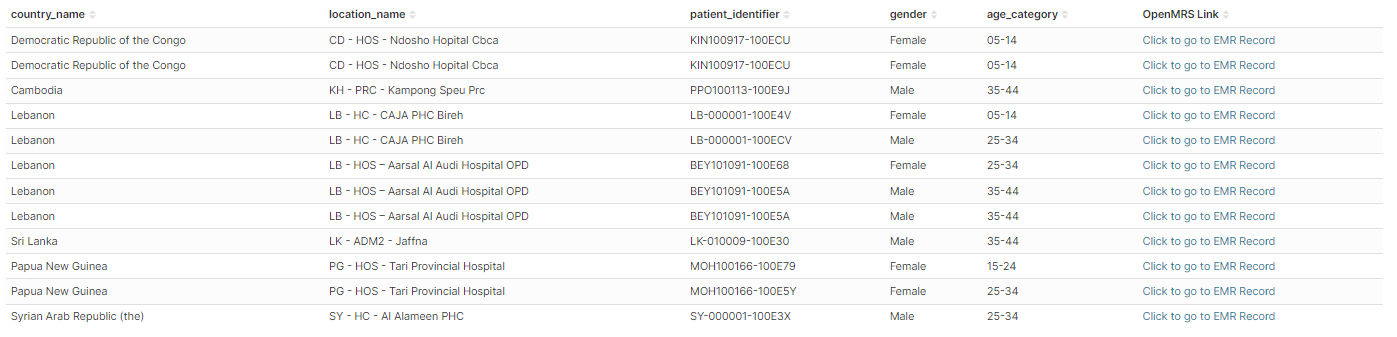
SO VALUABLE for retention/ preventing LTFU. The retention workers often use this view because it’s so easy to see “Oh, X# of people didn’t show up yesterday, let me click that block to see who they were”.
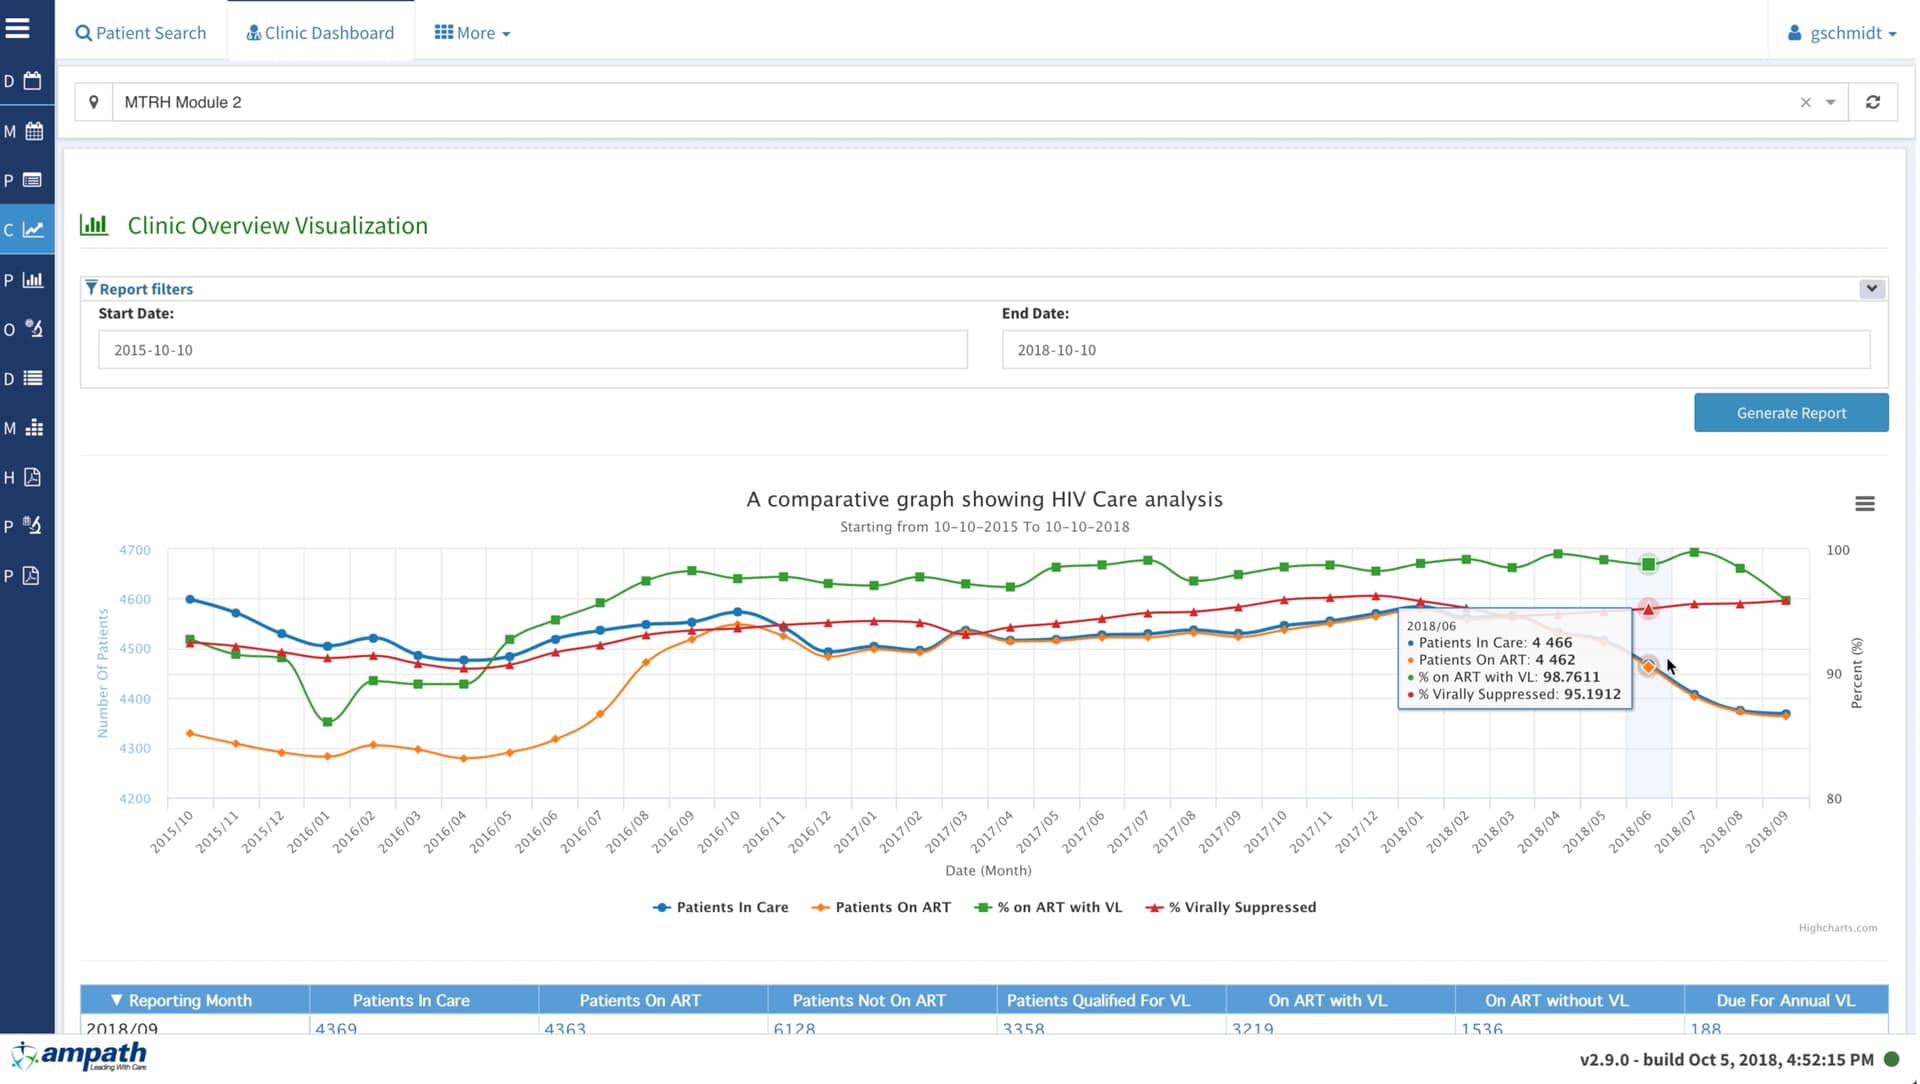
Valuable for Clinic Admins: One clinic admin I talked to especially loved this view because it gave him some idea of how his clinic’s suppression rates were trending.
This is not the type of thing that I think we’ve done at PIH before (that I know of), but having an option to show some kind of system-wide summary that can be permissioned so only the correct users see this when they log on would be a good addition to the O3.
As a feature, the capability already exists. Of course, someone needs to actually create the dashboards. The technical implementation is pretty simple: there’s already a homepage-widgets-slot on the default home app. You just need to plug widgets into it (which can be done via config) and associate those widgets with privileges (which can also be done via config).
Hi @grace ,
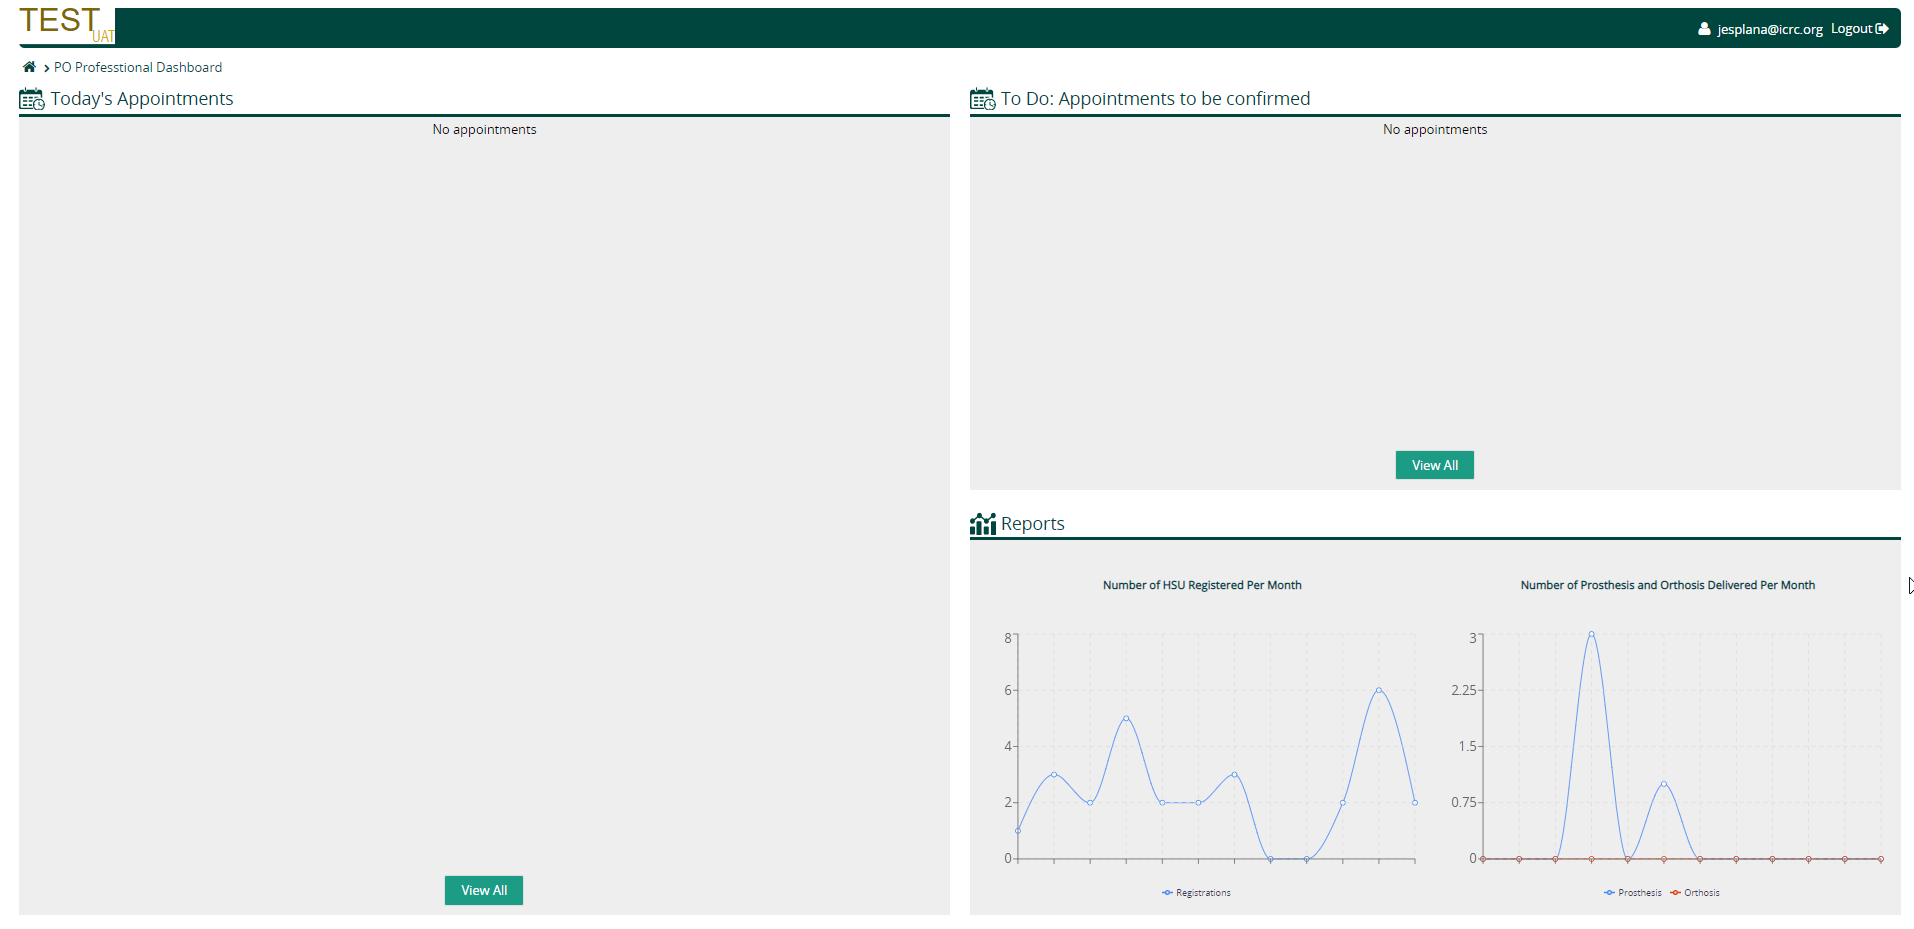
Certainly, we moved away from developing dashboard functionalities within OpenMRS to using an actual BI tool. In our case, we are using Apache Superset that ingest data from our OpenMRS instance.
test data shown below
In our OpenMRS 2 instance, we have the following dashboard:
But that was quite difficult to make any changes so we’re limited to what we can do.
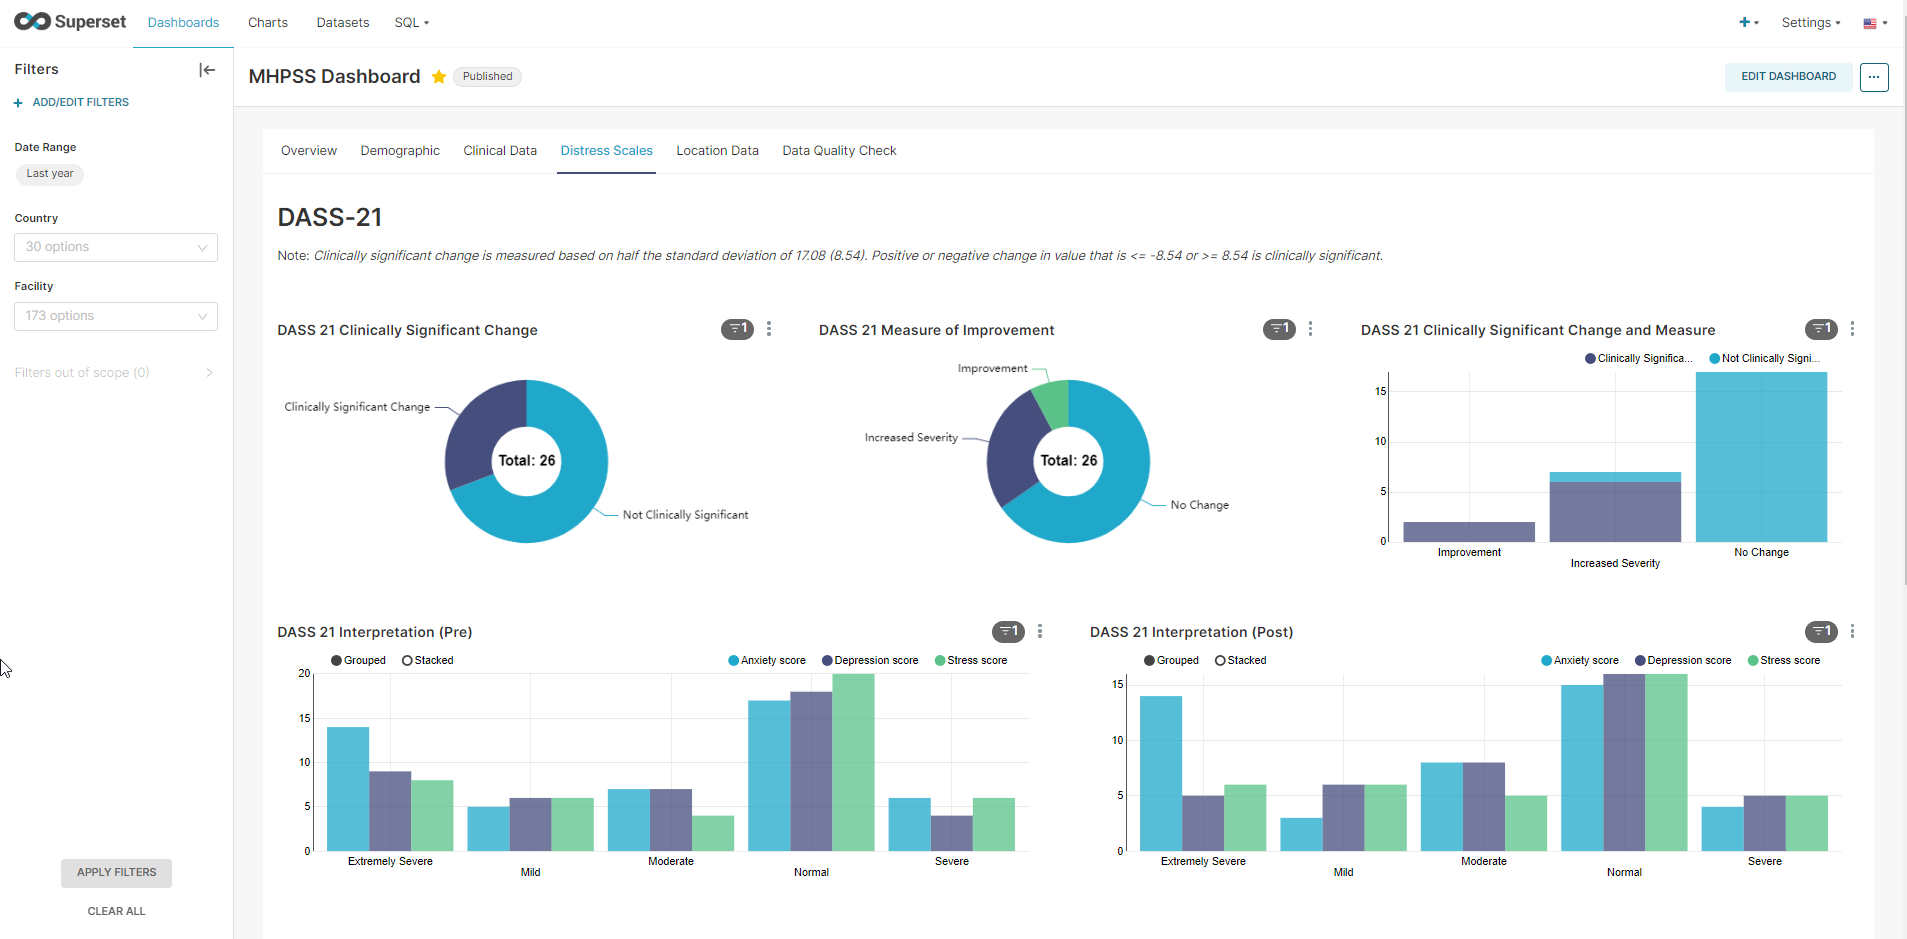
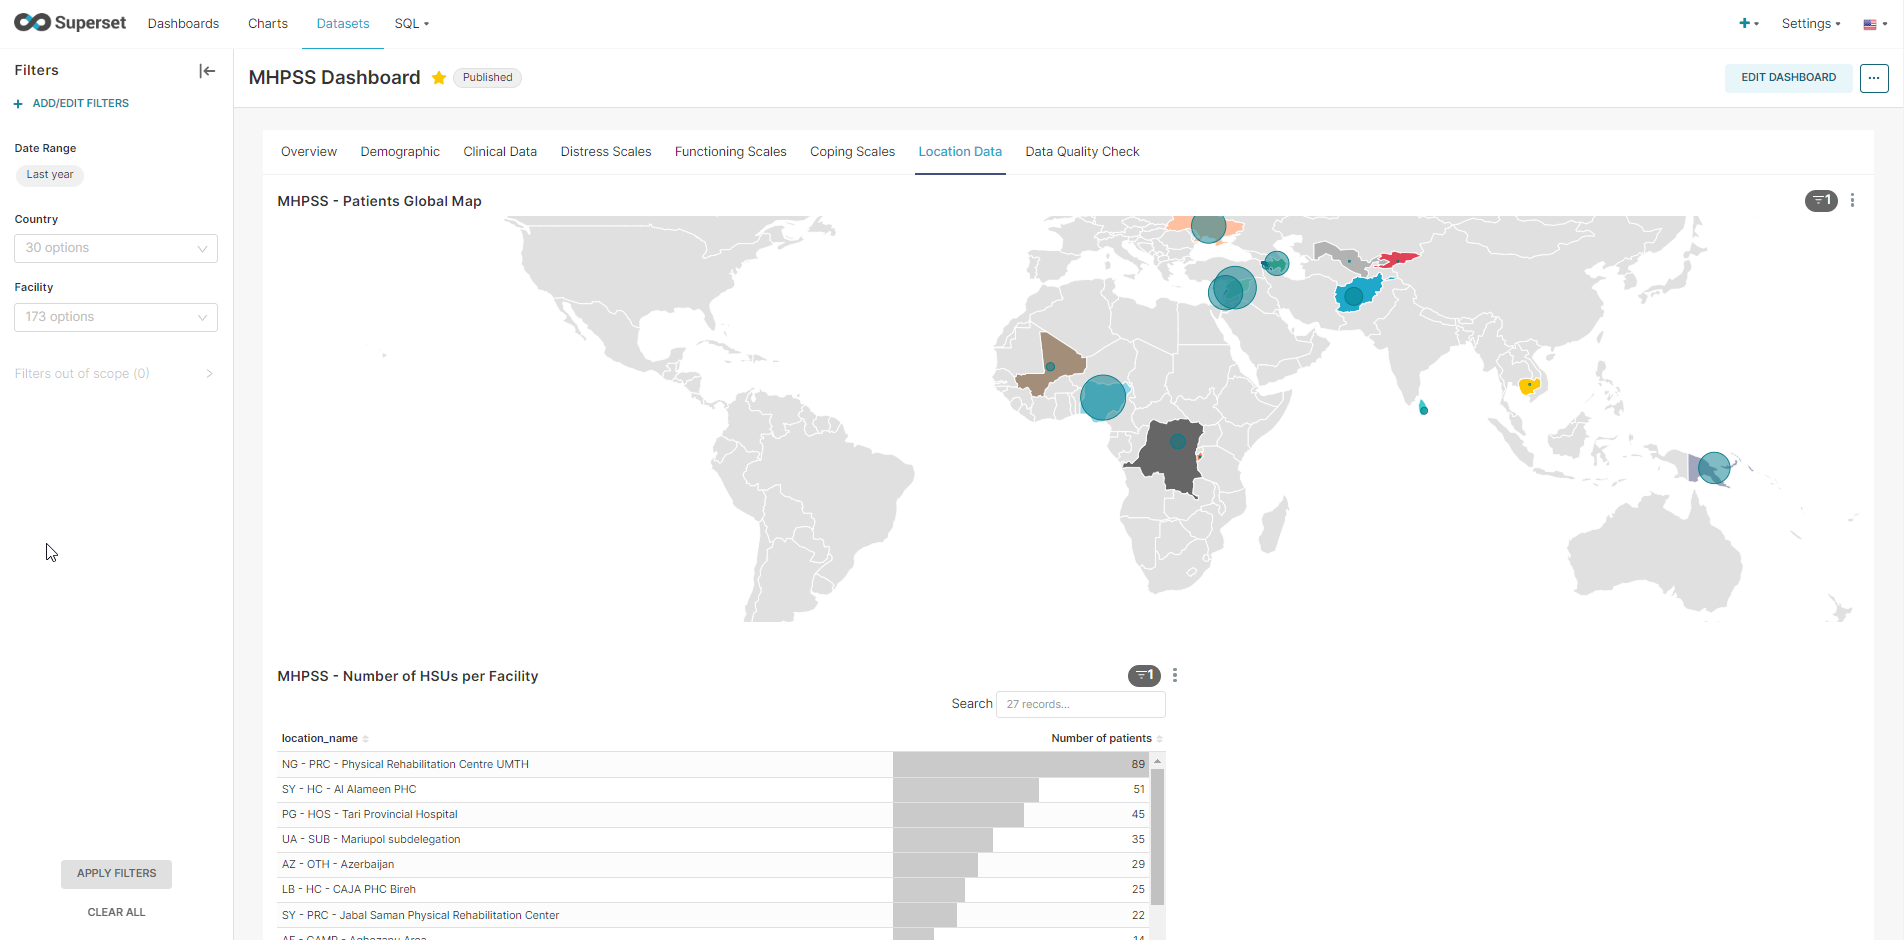
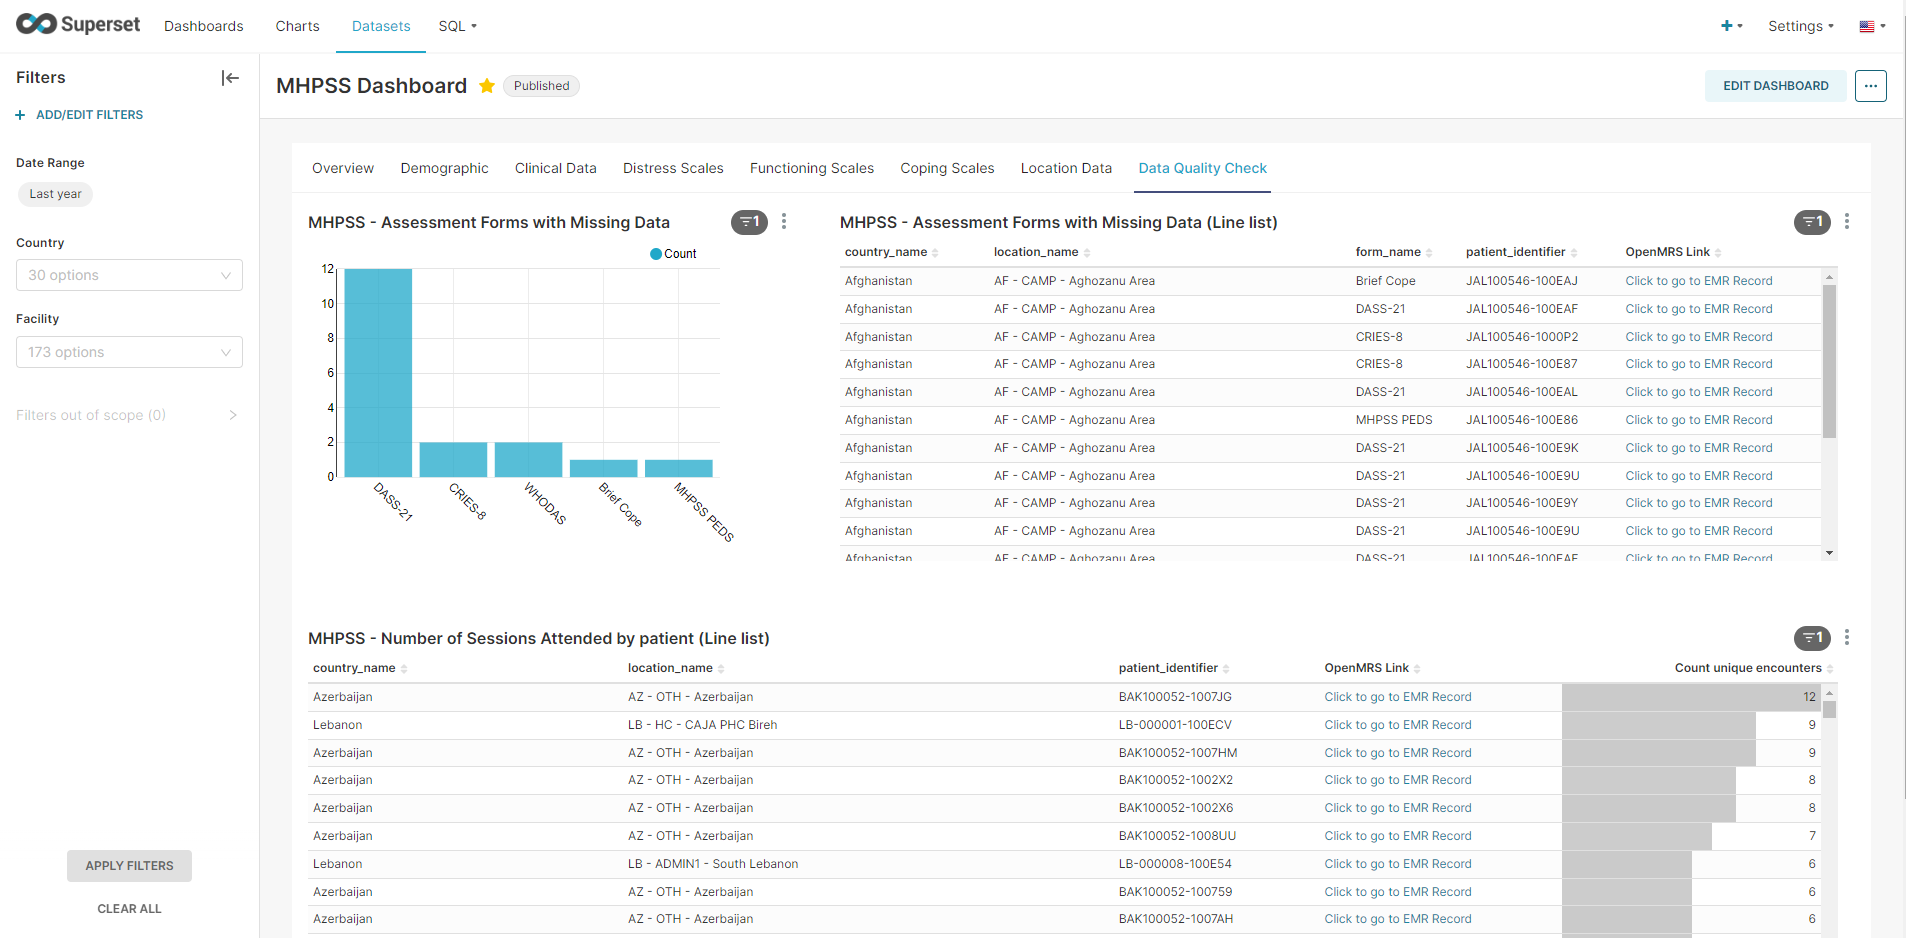
In O3, we have the following dashboard and we are developing it for all of our programs (Mental Health, Health Care in Detention, Hospital services and physical rehabilitation program). Data is streamed from O3 to superset every 2 mins:
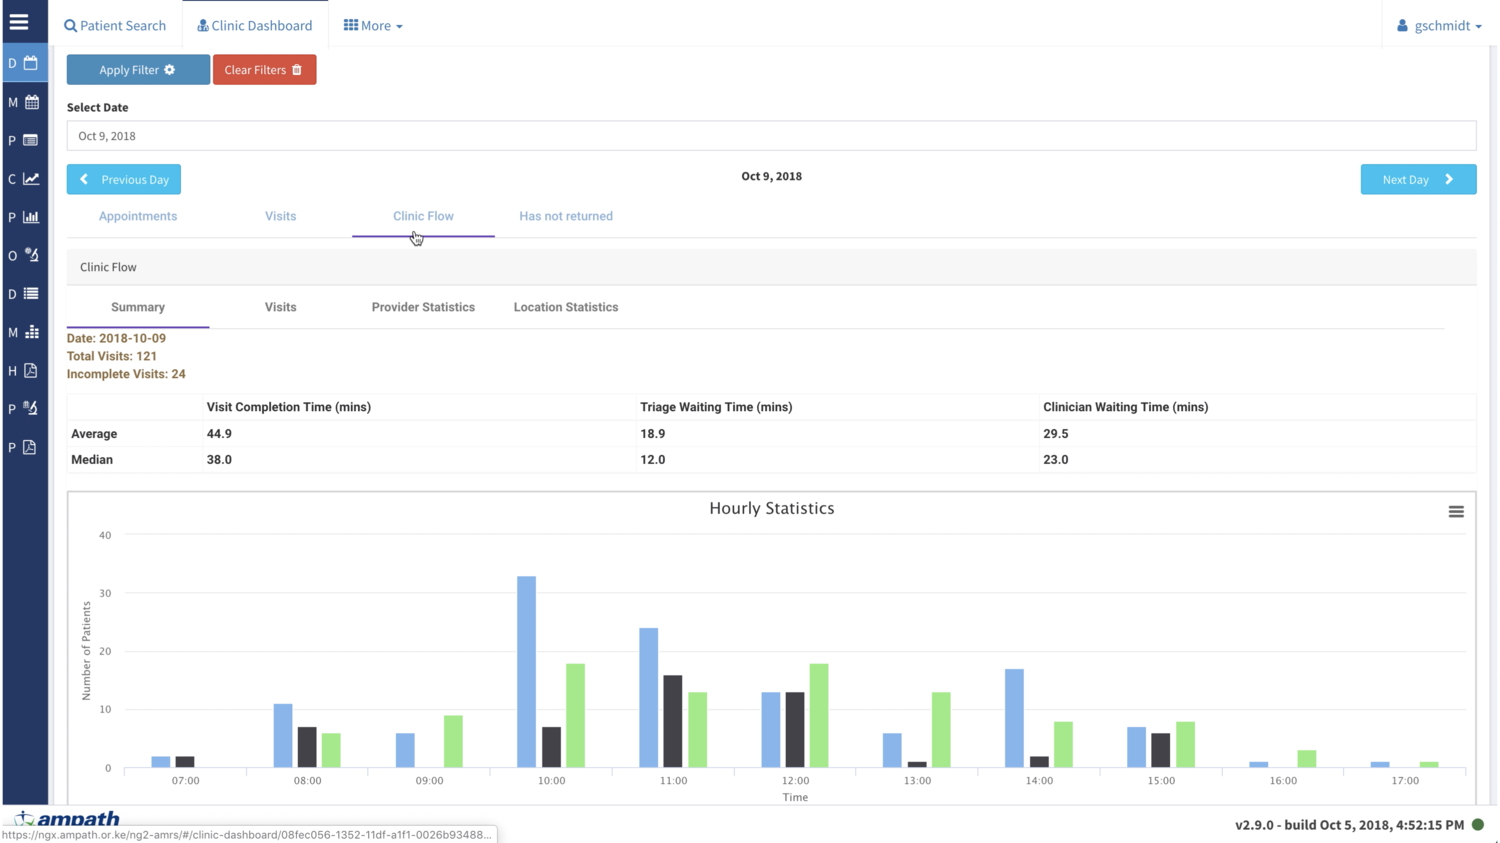
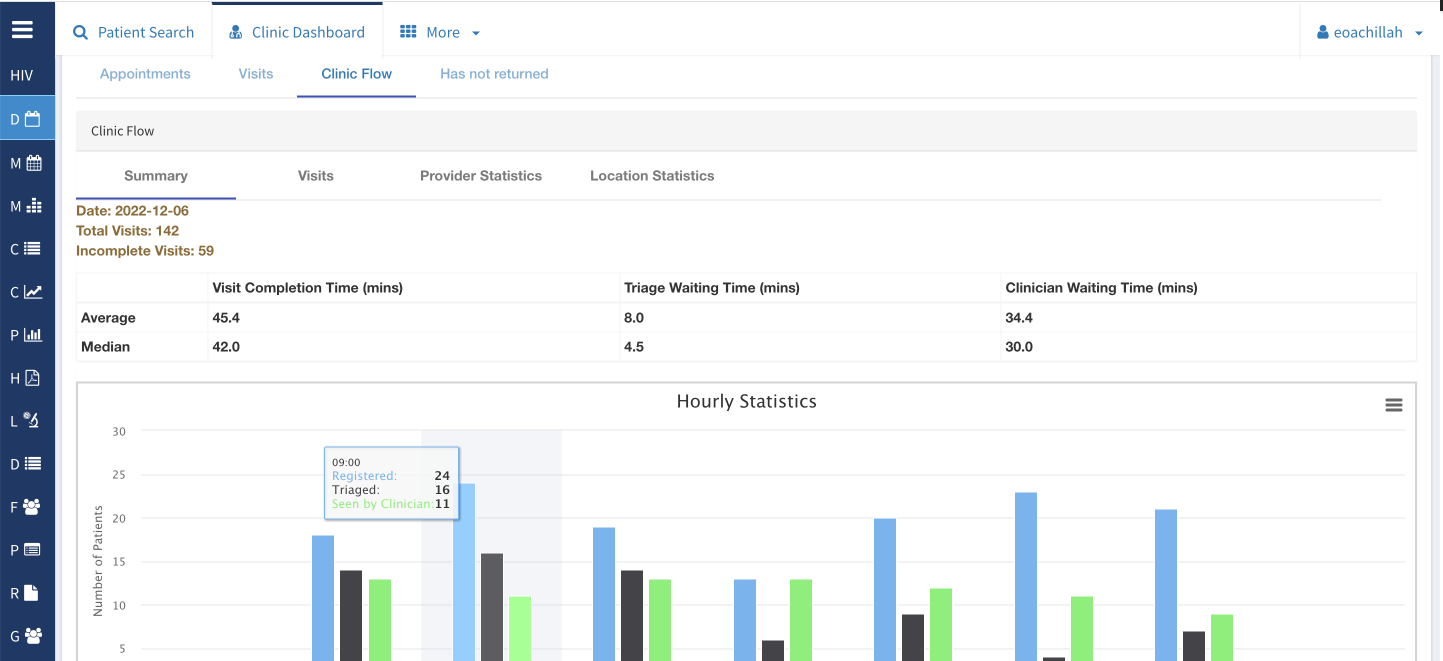
@grace the AMPATH clinic flow is often used by admins/clinic in-charges to get a sense of "what time of the day do most of the clinic workflows happen’, i.e. registration, triage and Seen by clinician. This would give an overview of which hours of the day are busy and with which activity/workflow. It is also from this view that clinicians can tell whether they had incomplete visits in their clinic to be able to do a follow-up.
The graphs are a representation of the different workflows and when you hover over the graphs, it will show you a count of the numbers registered, triaged and Seen by clinician.