In my quest to work around the loading issues of patientDashboard.gsp I realised that there were in fact two problems happening at the same time when loading that page for a visit with many encounters (say 100+).
The first issue is discussed here and is addressed by RA-1244.
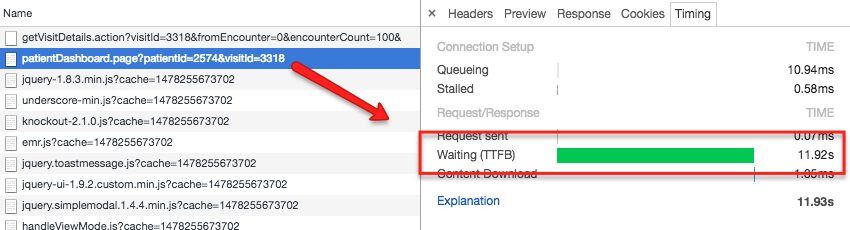
The other problem happens before anything else and I can’t quite put my finger on what is happening, look:
After that almost 12 sec waiting time, and only then, the first lines of the controllers are reached and other pieces of code (JS… etc).
But what may be causing this initial loading time?
Could anyone give pointers as to which directions to look at?
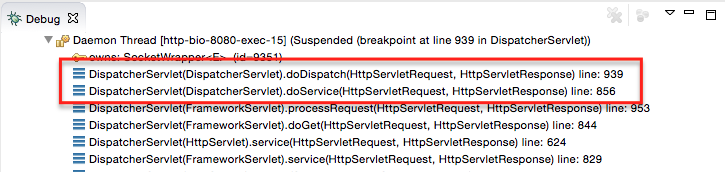
The webapp lands right away at the breakpoint in doService(HttpServletRequest, HttpServletResponse) and needs another 12 secs to reach doDispatch(HttpServletRequest, HttpServletResponse).
I’m not familiar with all this but I’ll try to understand what happens inside doService(..)…
What’s the value of handlerMethodToInvoke ? It should be the controller’s method with bad performance.
But I doubt that VisitDetailsFragmentController is the culprit, because it receives Visit as a parameter and is populated before. What’s the controller that obtains the Visit from DB, is it PatientDashboardPageController ? Maybe you should implement paging there … but the visit persistent already contains a set of encounters so maybe it’s impossible.
Tip: setting show sql in the hibernate config file will log all the SQL queries performed by Hibernate.
I am almost certain that it is not VisitDetailsFragmentController either. When debugging while loading the problem page, I can see that I go twice to handlerMethodToInvoke and that the second time is not problematic (no delay) and corresponds to VisitDetailsFragmentController (I can see that visually from the state of the page).
So it “should” be PatientDashboardPageController, but in fact it actually takes 12 sec to get to the first line of this controller as well. I was initially wondering if the Spring injection of some of its parameters could be the issue?
Just restarted everything to answer your actual question, here is what I see just before the delay:
So:
org.openmrs.module.uiframework.PageController@7ee3fc35 which could make sense with PatientDashboardPageController.
And the second time (so when there is no delay) it is:
org.openmrs.module.uiframework.FragmentActionController@c1469e8 which is consistent with VisitDetailsFragmentController.
If this was the case then it should take 12 seconds regardless of the patient, right ?
Both PatientDashboardPageController and VisitDetailsFragmentController have no ancestor class, I ignore its relationship with PageController and FragmentActionController.
If I were you I will keep debugging, enter the invoked method until you detect the performance penalty.
The only difference between two visits (one that loads normally and the one that takes 12 sec) would be how the model is filled right?
So by default that will be my next line of investigation: observe the model differences between two visits that have very different loading times…
But of course if something obvious comes to the mind of anyone following this thread, please jump in!
I would guess that somewhere in the gsp is a line that triggers visit.encounters to be lazy-loaded and this is what gets slow for visits with many encounters.
(It has to be something in the GSP itself, for the slowness to be coming from that line.)
So this guy takes up to 10 sec to run for a visit with ~1,000 encounters (sorry @lluismf, I gave misleading numbers earlier but here we go):
@darius, what do you think, in the context of Core Apps’ visits.gsp and our need of a quick fix, should we look at optimising that specific method and open an EA ticket, or would there be an easier/faster way to patch just that page?
After looking real quick, it seems that the main source of inefficiency is the 1,000+ calls of
@darius, @lluismf, could you point me to an example where something similar is done?
I’m talking about the plumbing involved in creating a new API function whose implementations rests on a SQL or HQL query.
And what’s your recommended approach to test (while developing) those queries? If possible on a real database.
Or I guess my question is: how can I play around with this without launching the whole webapp?