Hi,
I have 2 Report Datasets and each dataset has their dimension and I want to combine the result of two datasets into single excel template output.
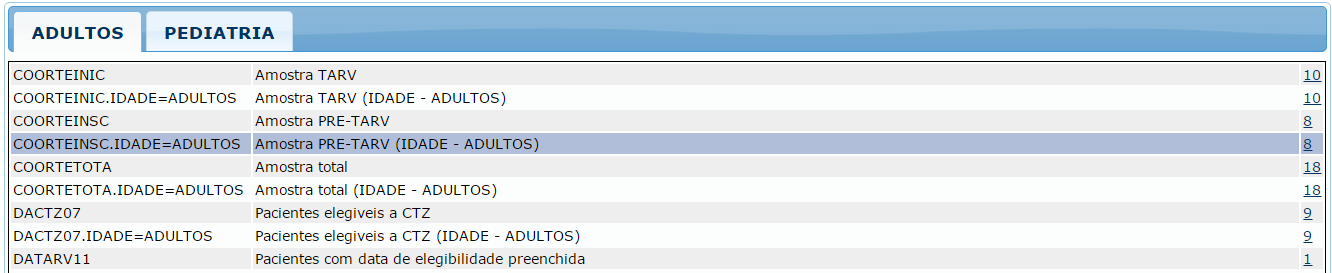
When I run the report with Web Preview I can see the results of 2 Datasets as shown on image (1)
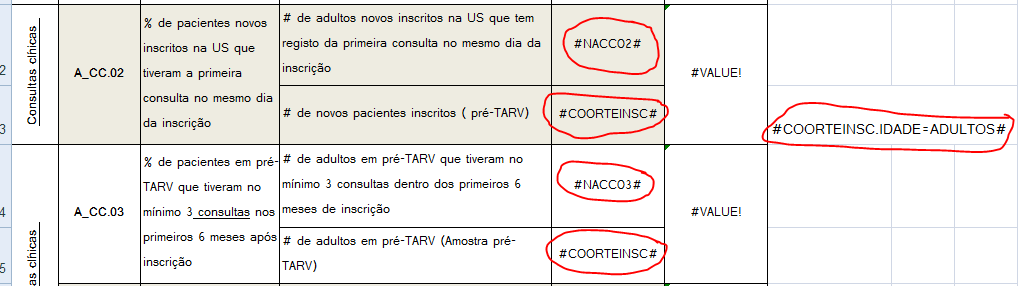
When I run the report with excel template (sample of excel template design shown on image (2)) no number is shown on template only appear the indicator codes as shown on image (03)
So, when I remove one of dataset everything works fine.
Is there any tip how to design excel template custom report with two datasets?
Thanks in advance
Is it possible that you are not specifying the dataset that the “variables” are to come from? Per the wiki at https://wiki.openmrs.org/display/docs/Render+a+Report+Into+a+Custom+Excel+File…
*Multiple DataSetDefinitions: *If the report contains multiple DataSetDefinitions, indicator values must be prefixed with the DataSetDefinition name. For example, #firstDataSet.1.A#
If there is only one dataset in a report, then you can simply refer to the columns in that dataset directly (eg. #columnName#).
If there is more than one dataset in a report, then you need to qualify which data set the column you reference belongs to by adding the data set “key” as a prefix. So, if you have added a data set with key “dataSet2” to the report, you would instead reference the above as #dataSet2.columnName#.