While setting up Bahmni on a remote CentOS server, I’ve noticed that the performance is not so great.
It takes very long to load pretty much any page.
For instance, loading the patient search page /bahmni/clinical/index.html#/default/patient/search take between 30 and 40 seconds
The server I’ve set up matches the official requirements:
CPU x4
RAM 8GB
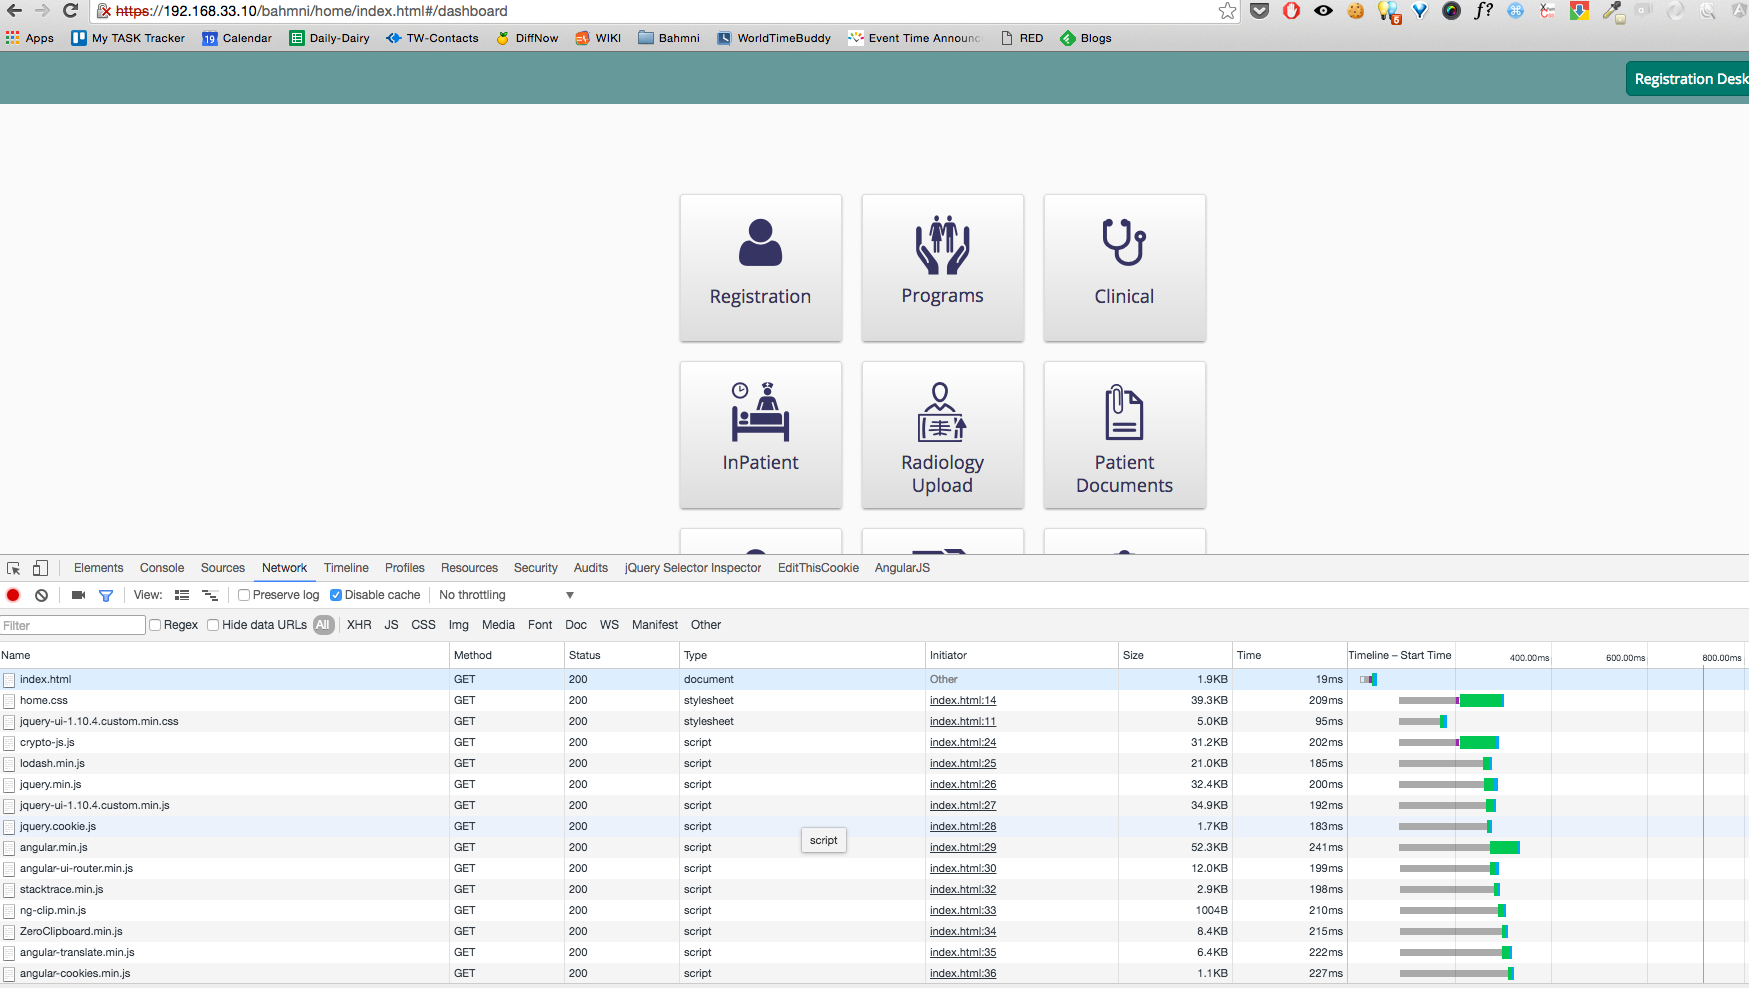
In order to find out what happens in more details, I’ve compared the performance of a page of OpenMRS while running from a Bahmni server VS the same page on a server that runs OpenMRS Ref App only.
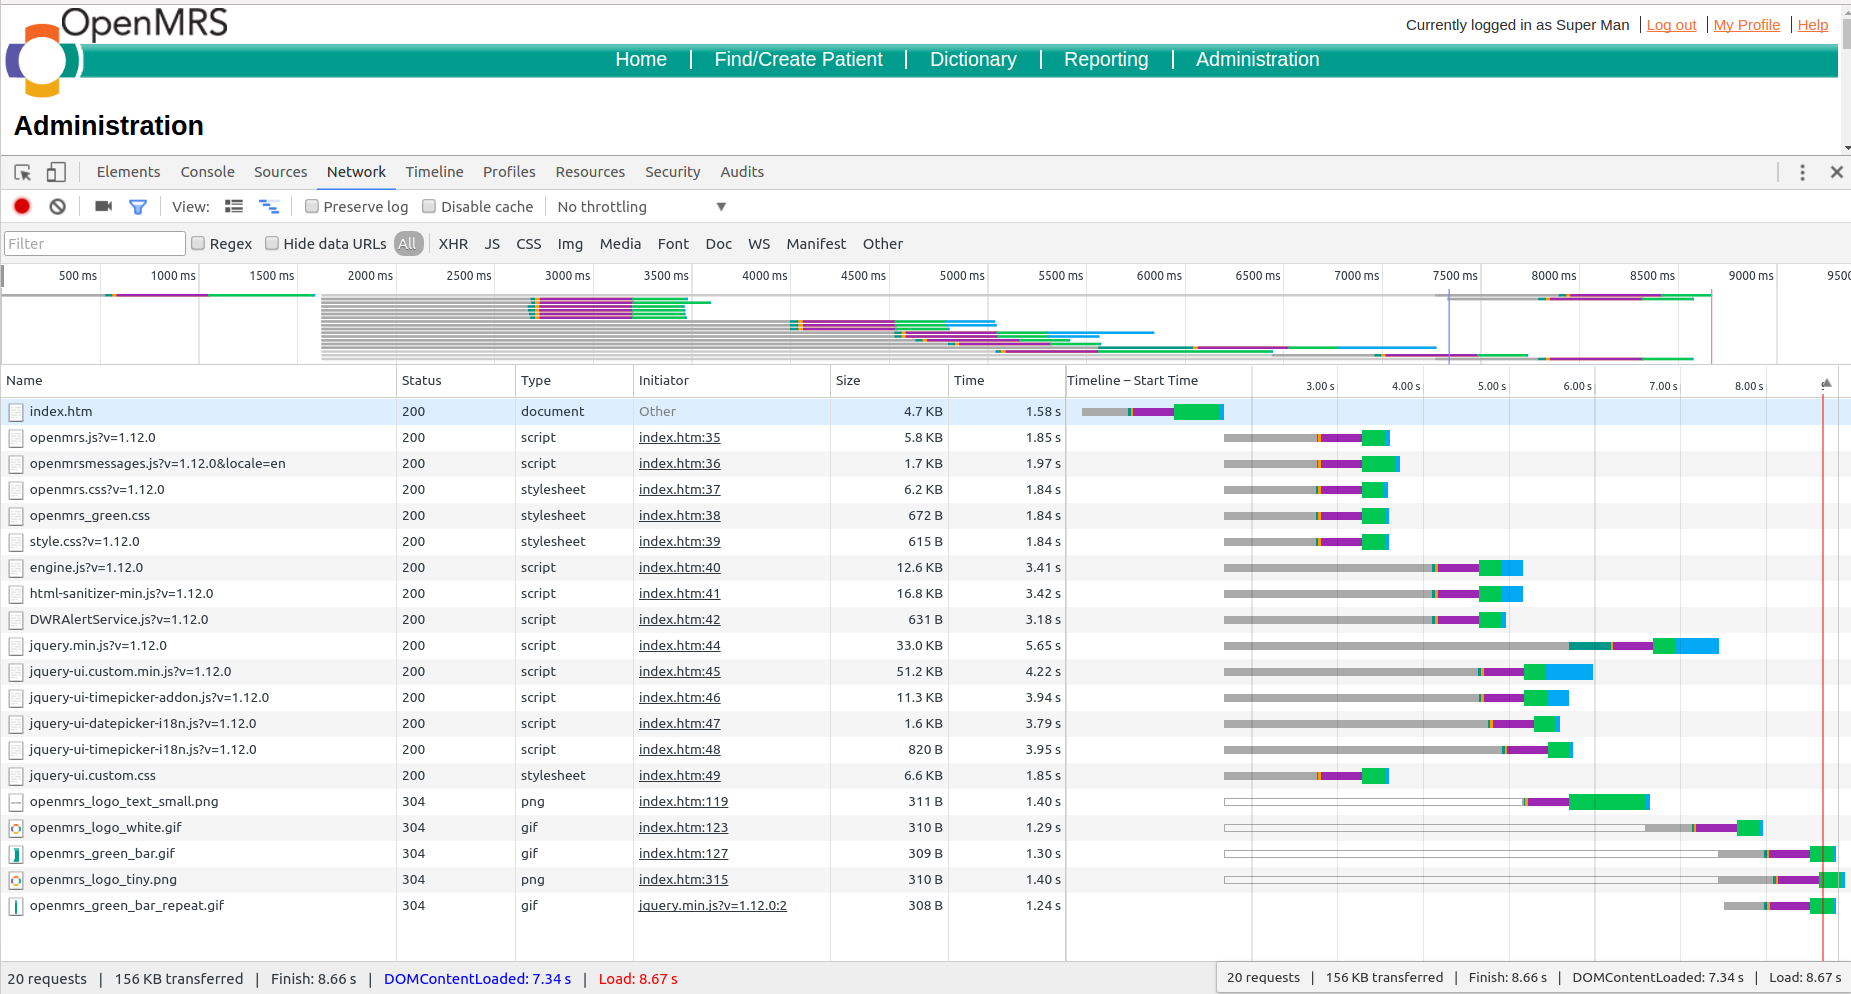
Let’s load /openmrs/admin/index.htm on the two different servers and see what happens…
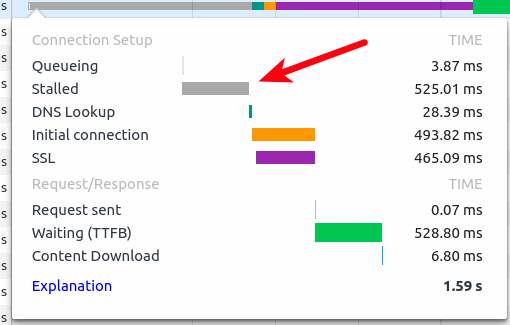
This applies to all JavaScript resources, CSS, icons, fonts, etc, while I guess it should be restricted to sensitive data only. Therefore, every resource takes around 500 more milliseconds to load.
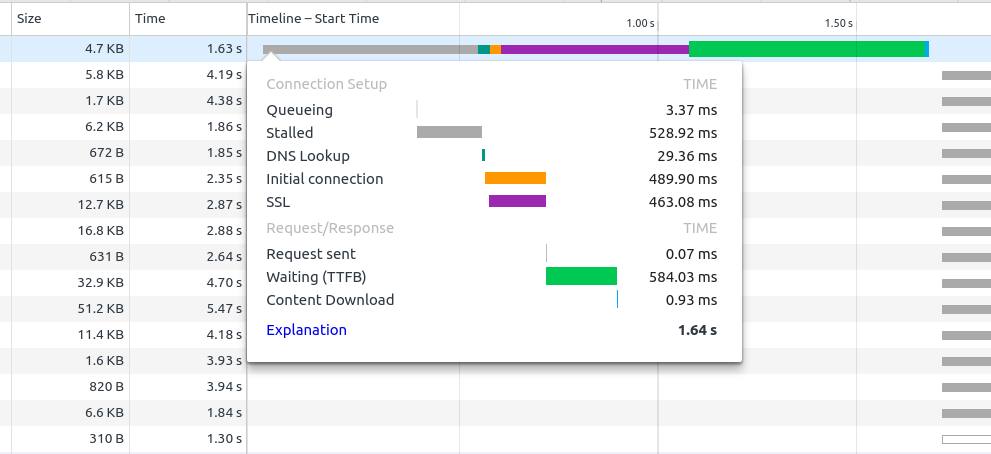
This applies for every resource as well. But it is specific to Chrome (I am running Version 51.0.2704.84). In Firefox or Safari, this ‘Stalled’ time doesn’t exist:
Can you please share more details – like for instance, geographically is the client & server in the same location / country?
Also, I don’t think its an issue loading resources over https. In fact, its common and recommended for security to have as many resources as possible loaded over SSL (to avoid injection). If you see GMAIL, it also does the same.
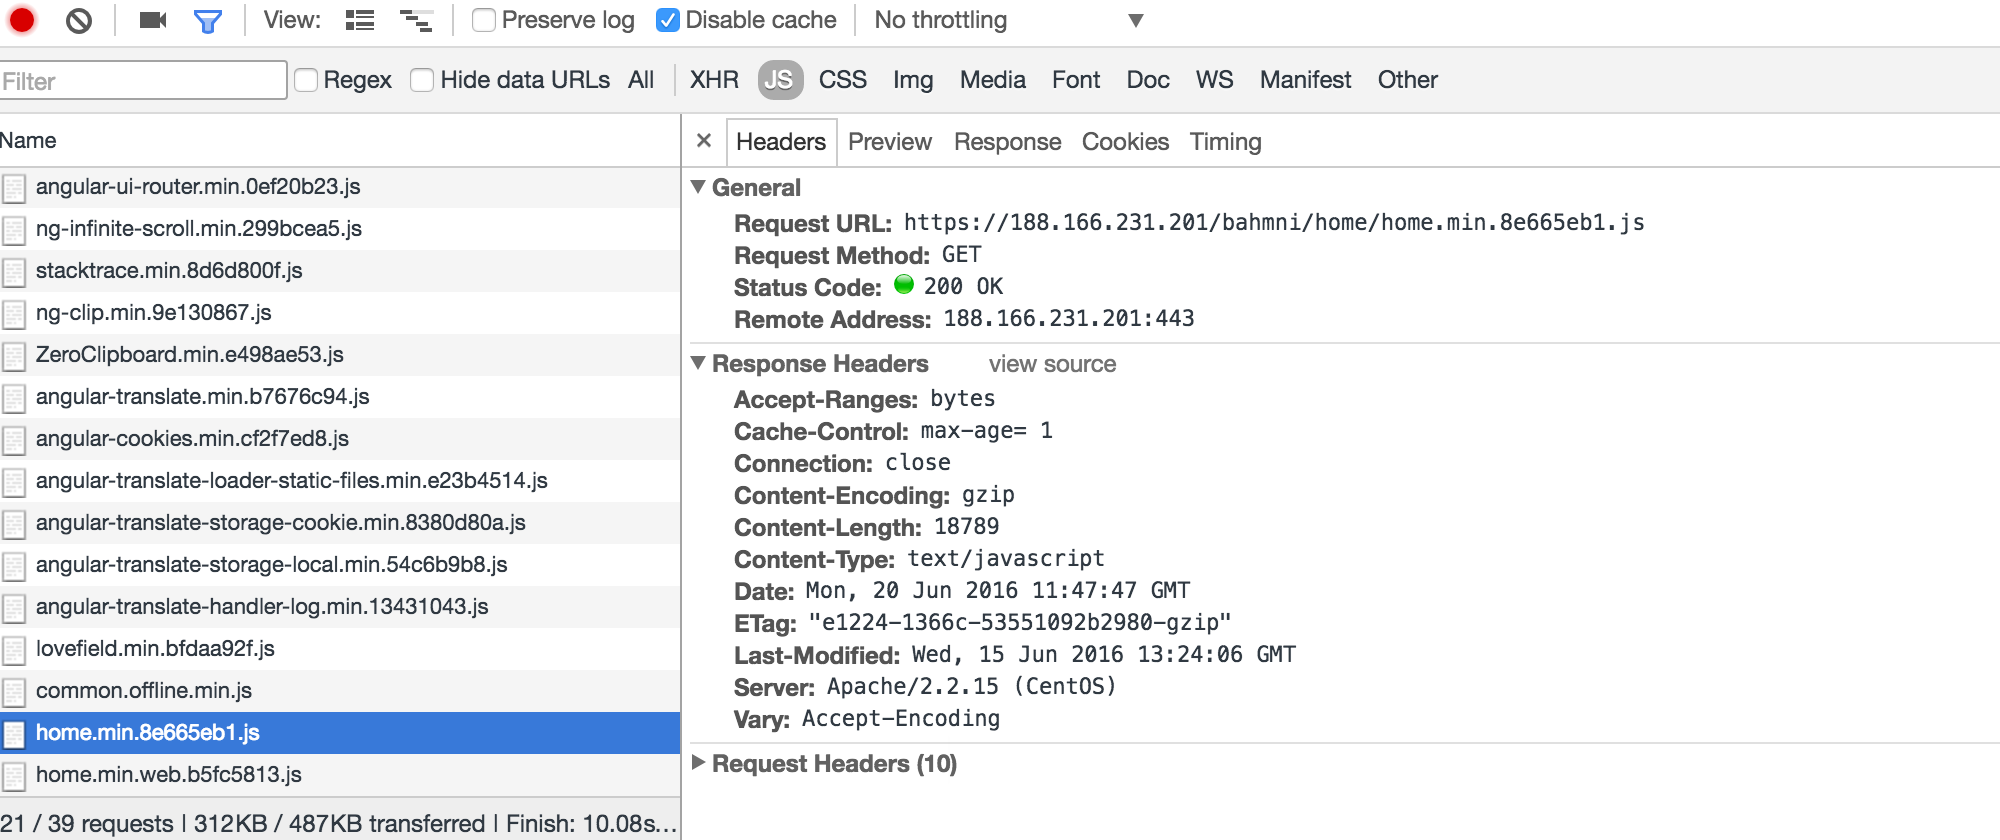
I also notice that all JS assets seem to be fingerprinted (someone else from Dev team can confirm this)…and hence ideally the cache time for resources should be set to a large value (30 days / 1 year), since on change of the resource, its fingerprint anyways changes. But, from my analysis, it seems max-age is set to 1. If we change this, we should see a performance improvement in loading time.
We should also fingerprint image assets, and then set their cache times to longer periods. Right now icons / images don’t seem to be fingerprinted, and again max-age=1 (second!).
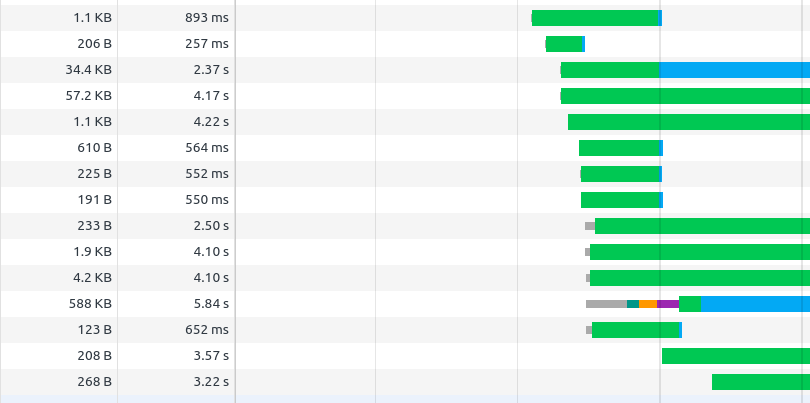
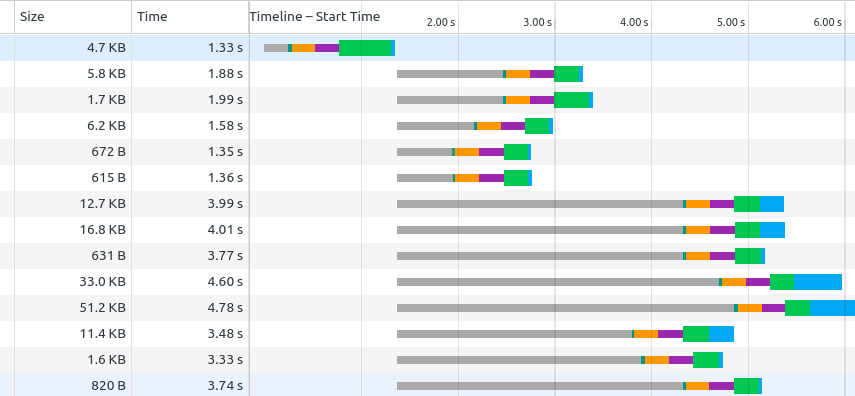
However, what worries me is that this ‘Orange and Purple’ time (whatever it really is) exists for every resource, while in Gmail (or Facebook), the resources just don’t have this phase at all (or just one or two times).
Sure. I am currently in Cambodia, with a 10Mb/s stable connection, and the server is located in US West cost.
Ping to the server is around 245ms.
I know this is not great.
The performance is improved when re-locating the server in Singapore.
Ping to server in Singapore is 90ms and the same page takes 5s to load. Still not good.
For info, the patient search page in Bahmni /bahmni/clinical/index.html#/default/patient/search takes 23s to load on the server in Singapore, and more than 40s on the US server
Thanks for your research. This is interesting (Orange and Purple for each Bahmni call).
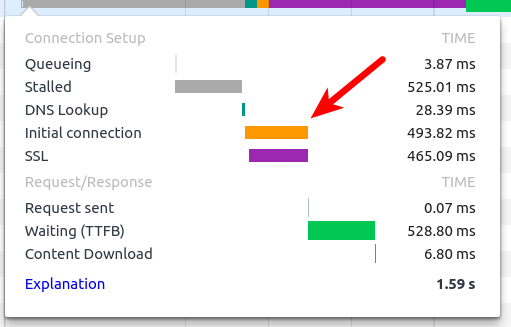
I did some more research. Turns out that Orange/Purple represents Connection Initiation & SSL Handshake time for a resource. More details here: Chrome DevTools - Chrome for Developers
When I try the command suggested by the first link on a Bahmni resource, it turns out KeepAlive is OFF. See the second line for Bahmni URL, the tcp values are not 0 (like they are for Facebook)
This means that for each resource a new connection is being initiated (since the previous connection isn’t kept alive)
Then I realized that the Apache httpd.conf has KeepAlive Off (as mentioned in article - this is default for Centos).
So, I did the following:
Made KeepAlive On in the Apache config file:
vi /etc/httpd/conf/httpd.conf
sudo service httpd restart
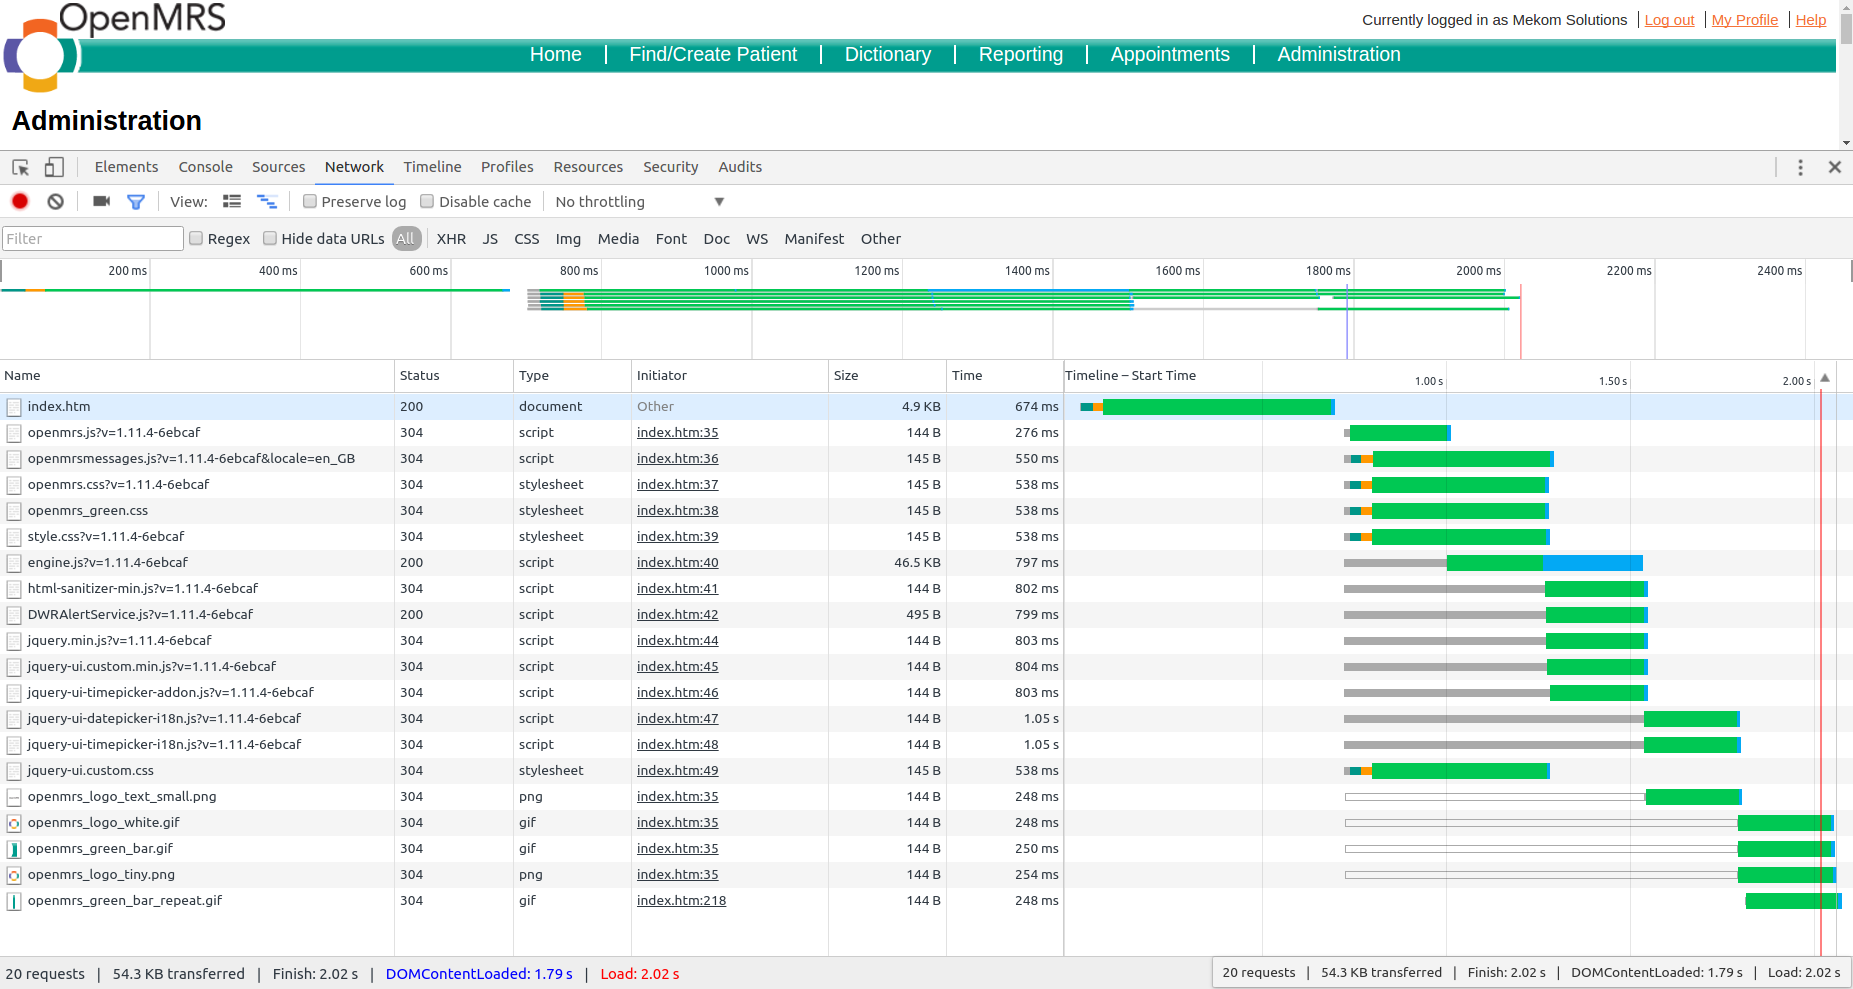
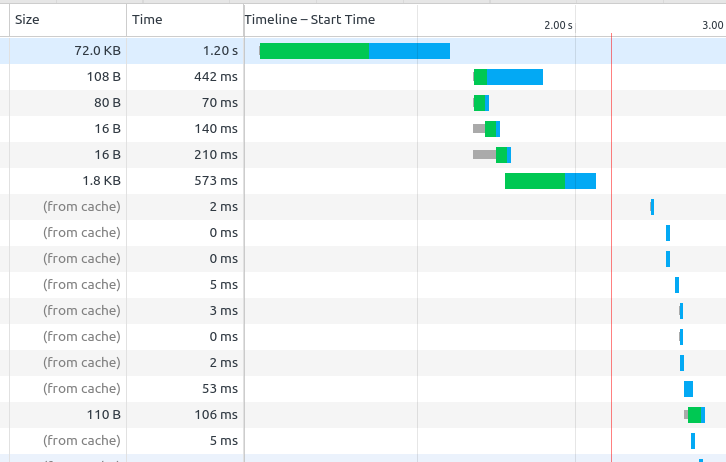
Now, I don’t see the Orange & Purple for each resource!
I’ve tried it and the loading time is waaay better now!
Reloading the page /bahmni/clinical/index.html#/default/patient/search now takes 8 to 10 seconds
Which is 25% of the time it took before the KeepAlive On. Thanks @gsluthra
Now, I notice that it takes slightly more time when loading the page for the first time, than reloading it.
I guess this is because of the KeepAliveTimeout parameter that is set to 15s and it needs to SSL handshake on the first resource.
In my original message, I also mention that there is a ‘Stalled’ time spend in Chrome during which nothing happens and that doesn’t happen in Firefox/Safari.
Now, I am not sure if it is just because Firefox & Safari include this time in the ‘Connecting’ and ‘Waiting’ duration and therefore doesn’t show it in its console, but in the end, the loading time is still longer in Chrome.
We can switch back to KeepAlive Off to accentuate the problem and try to find out what happens.
Loading time for the first resource (index.htm document only (not the page)):
I believe if we fix the Cache headers on the static assets, browser will start caching more resources, and overall load times should improve.
Someone from team will need to investigate your final question on stalling / load time between Chrome and Firefox. But for now we only support Chrome (and maybe since Firefox is doing things fast, its skipping some stuff that Chrome doens’t )
It’s not an exact science and there are many things that can impact performance - but it may help when communicating why things are slower over larger distances.