Hi Everyone,
I’ve been reading through `openmrs-esm-patient-growth-chart-app` and running it locally, and I’d like to propose adding CDC growth references alongside the existing WHO ones. Before writing any code I wanted to check the approach with people who know this module better than I do.
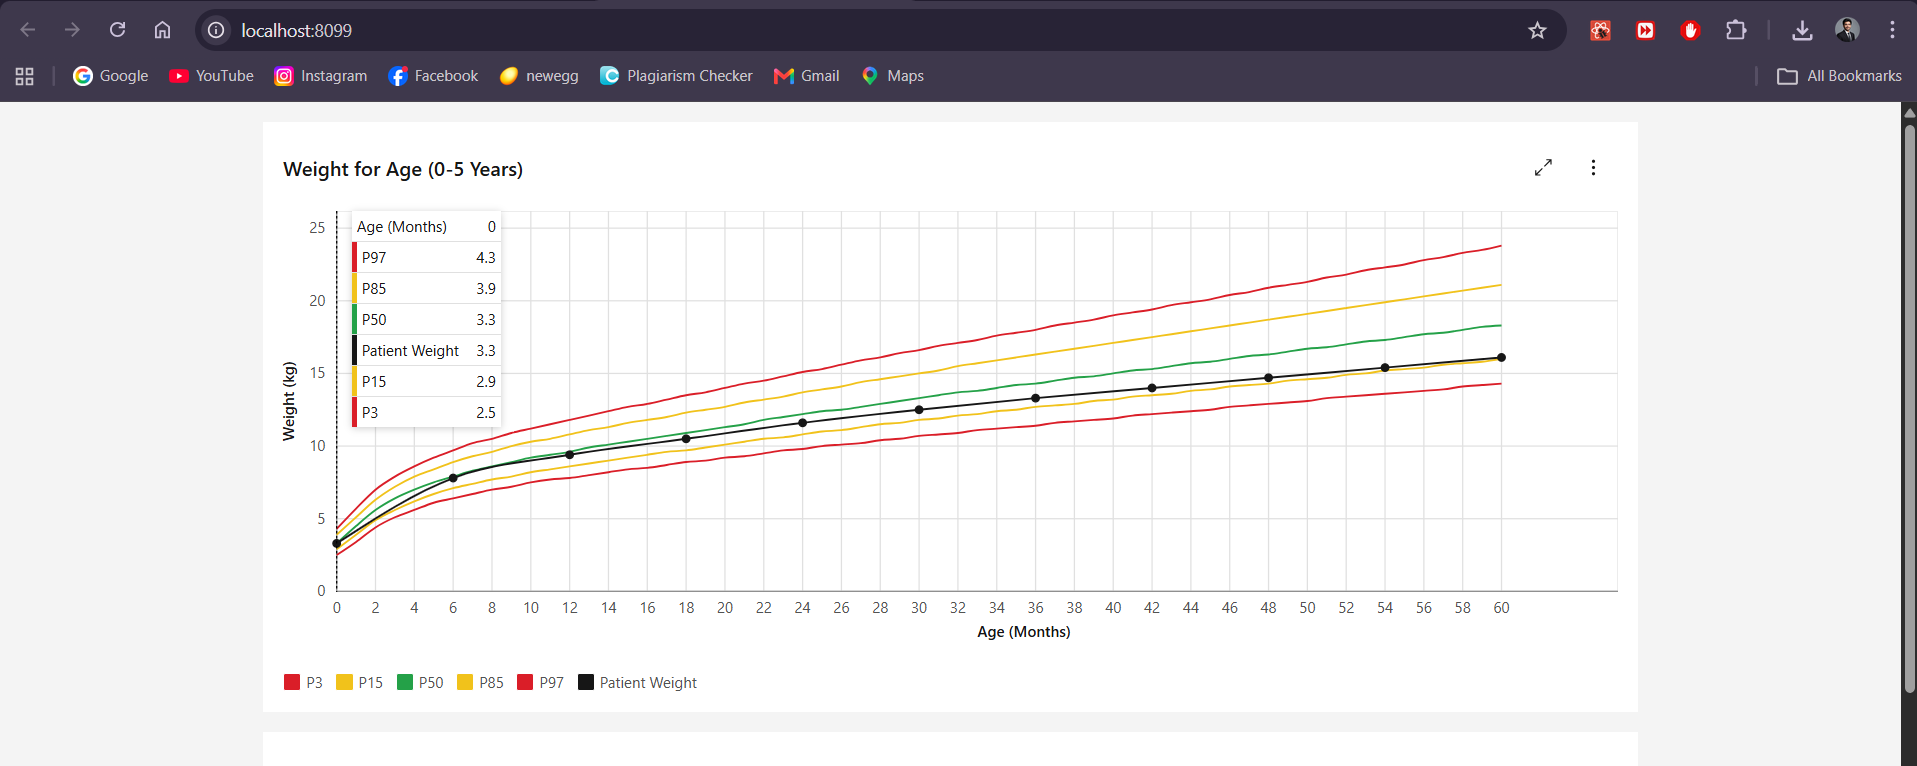
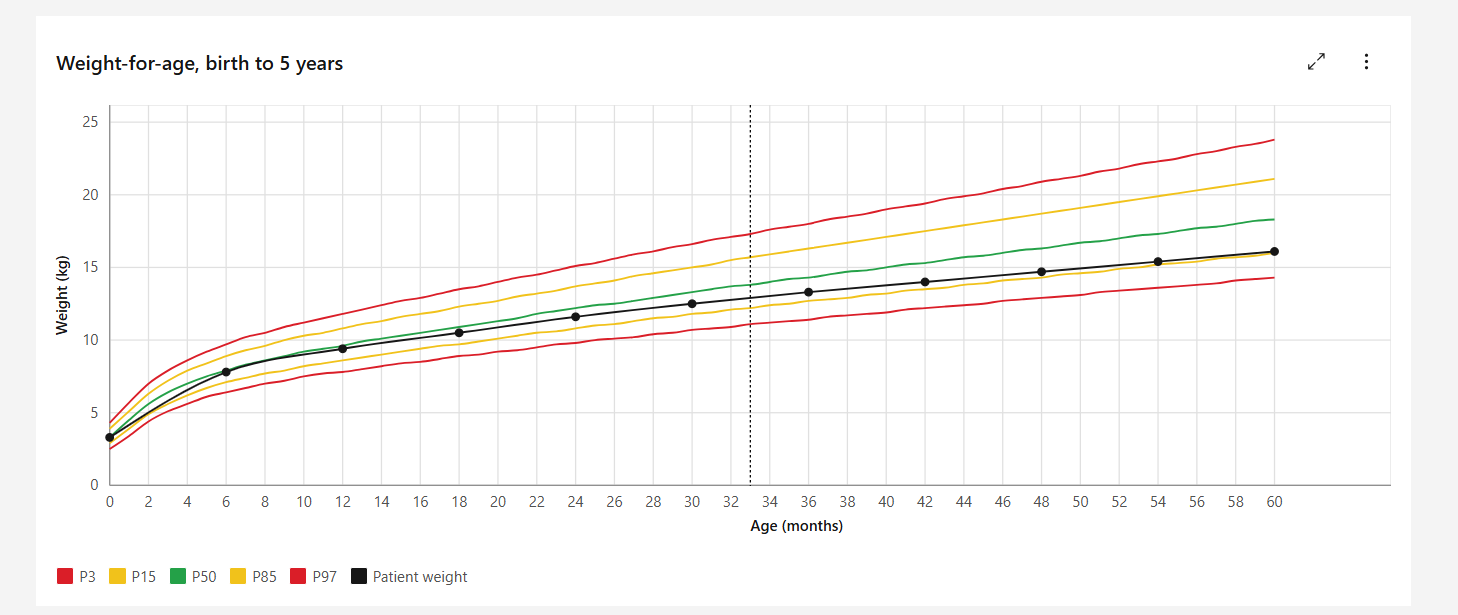
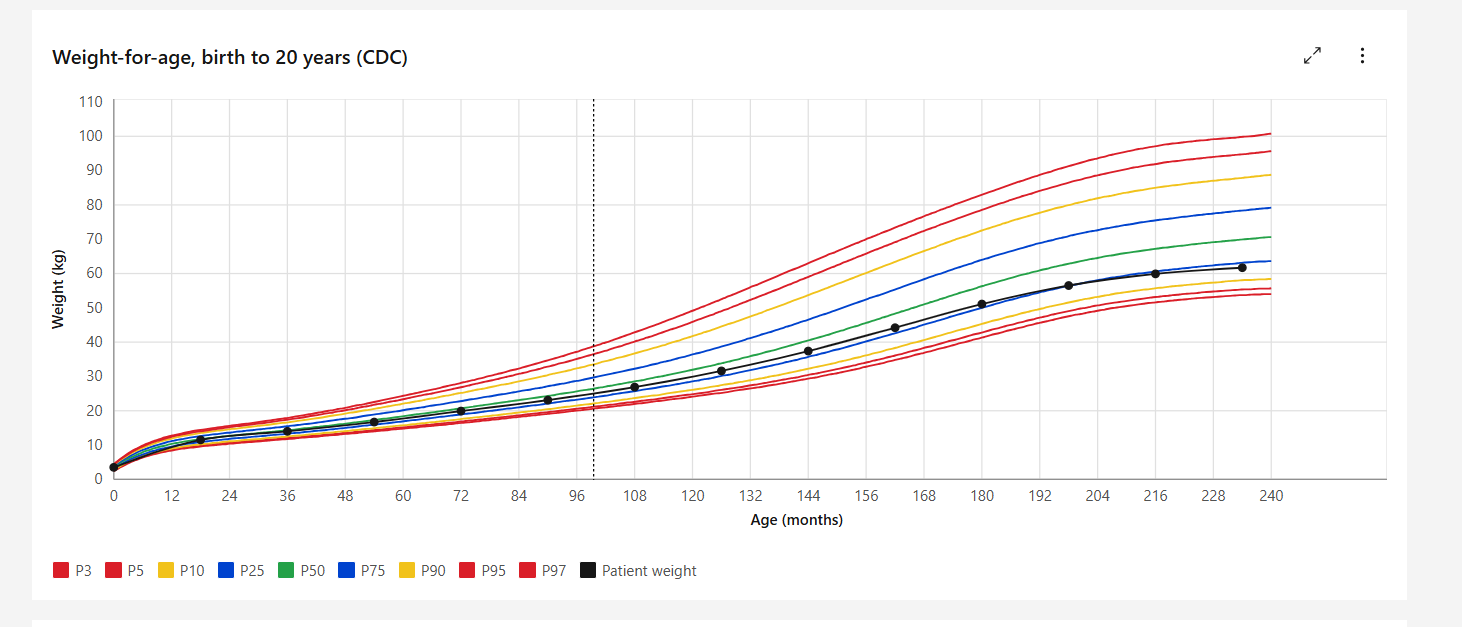
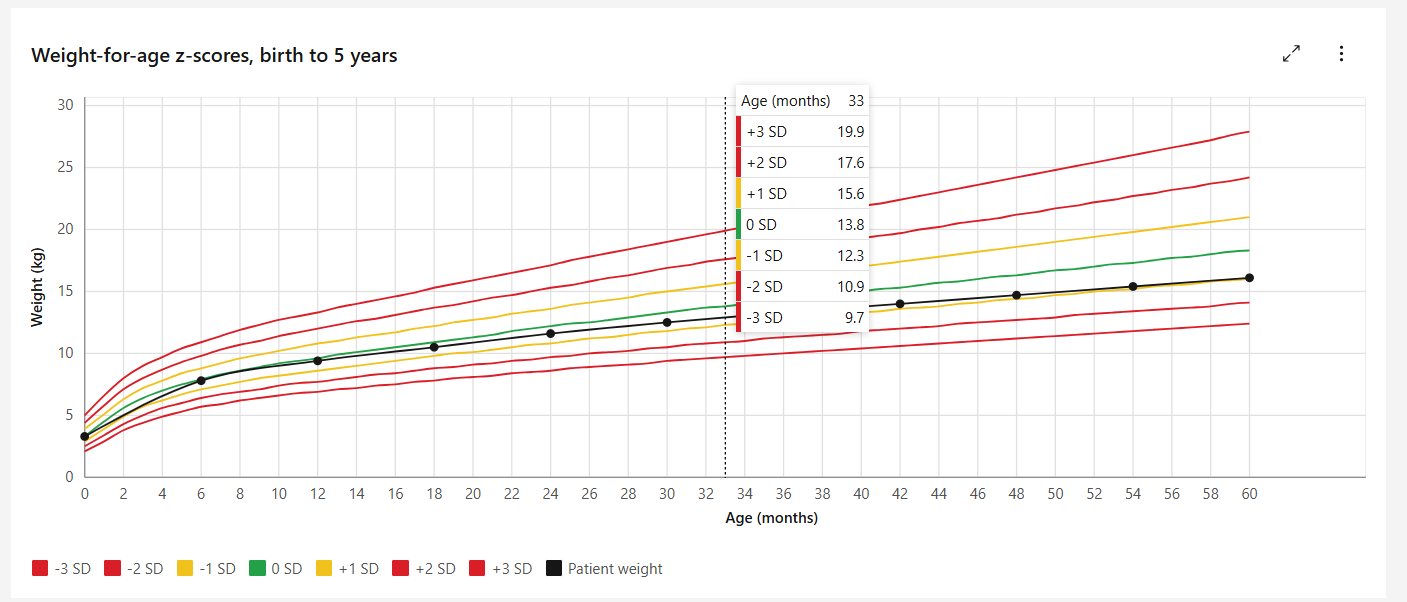
**Where things stand.** The module ships WHO weight-for-age for birth to five years and renders it well. Patients over five hit an empty state. The README already lists CDC as in scope, so this is filling in something that was planned rather than proposing a new direction.
**What I found while working out where a second dataset would go.** Most of the chart is shaped around there being exactly one — the percentile list, the colour map, the axis ticks, the chart title and the age cutoff are all literals in `growth-chart.utils.ts` and `growth-chart.component.tsx`. That’s a completely reasonable way to ship a first vertical slice, but it means adding CDC is mostly a de-hardcoding job rather than a data drop.
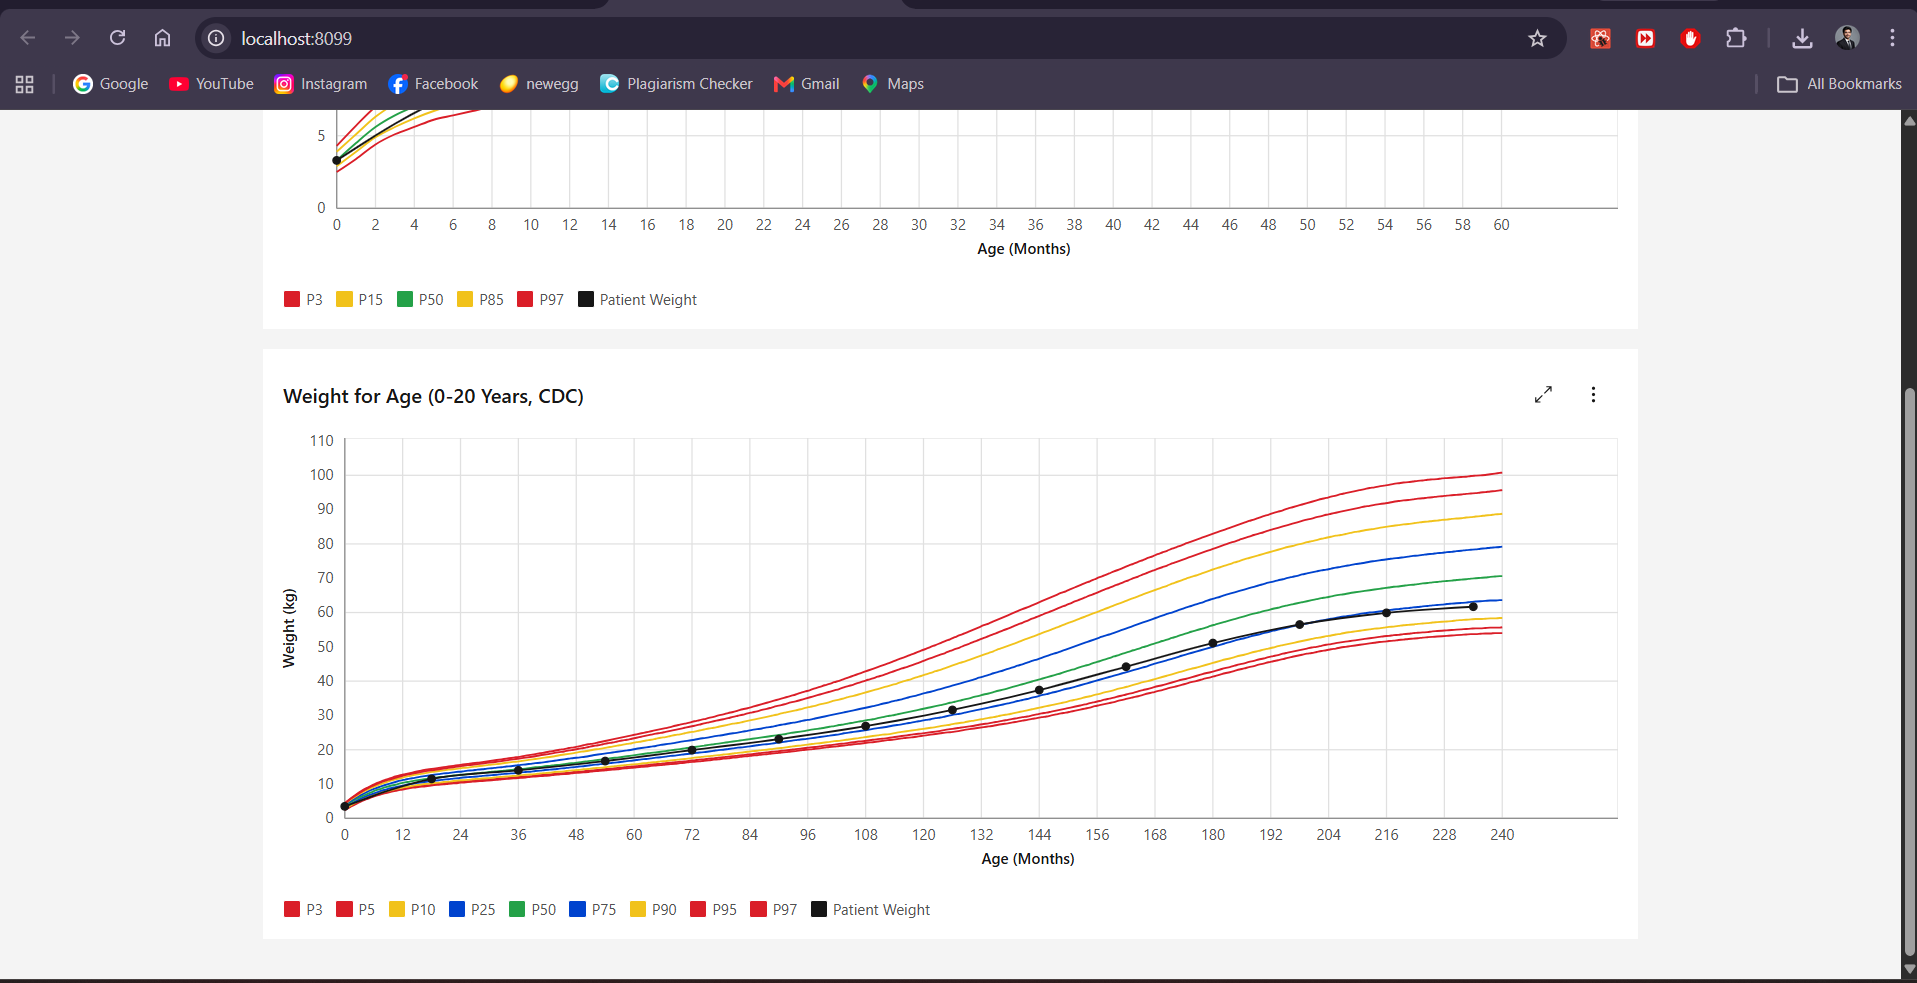
One thing genuinely blocks the simple approach: **CDC publishes no 15th or 85th percentile for weight-for-age.** Those columns exist only in the BMI-for-age and weight-for-stature tables. CDC’s chart uses 3/5/10/25/50/75/90/95/97 where WHO’s uses 3/15/50/85/97 — that’s what each body’s printed chart actually shows. So the curve set has to become a property of the dataset rather than a global constant. WHO’s chart then stays exactly as it is today, and CDC draws its own.
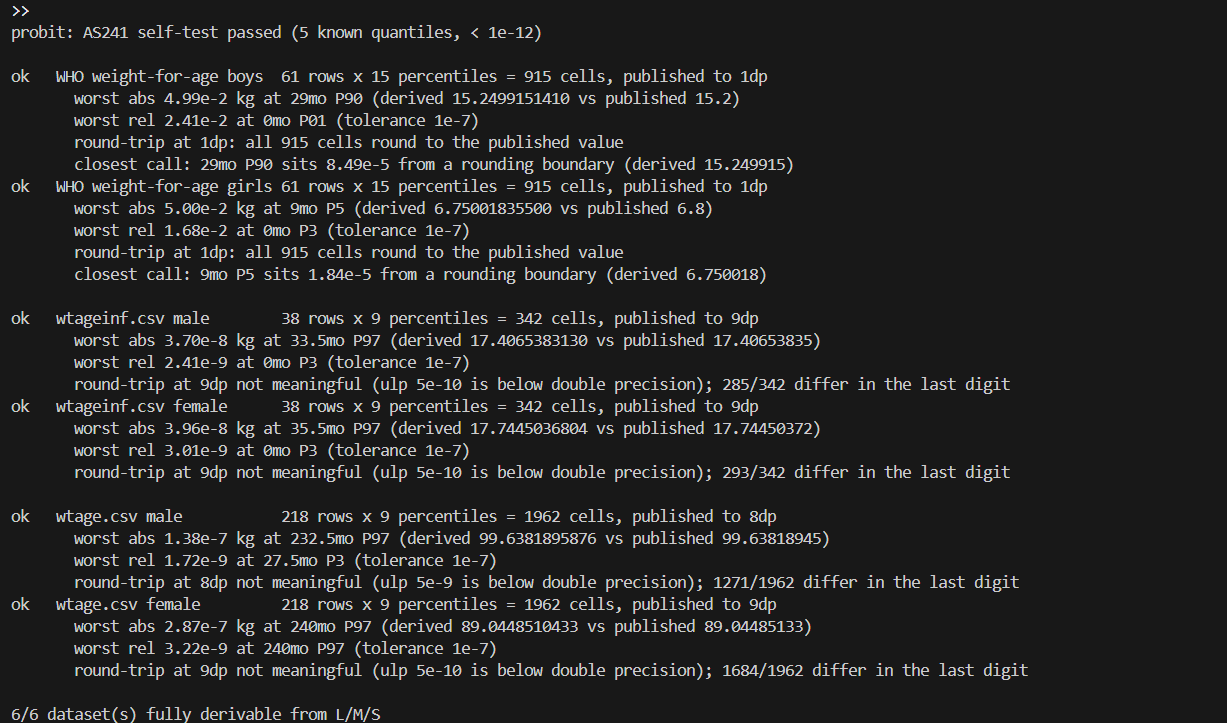
CDC also splits weight-for-age across two files (birth–36 months, and 2–20 years) that overlap. I’m proposing the 24-month switch point CDC’s own SAS program uses, implemented in a committed generator script so the data is reproducible rather than hand-converted.
**The payoff** is that five- to twenty-year-olds get a real chart instead of an empty state, since CDC weight-for-age runs to 20 years.
I’ve written the detail up properly — investigation notes with file references, the proposed refactor with before/after code, requirements, test plan, and a two-PR delivery plan:
PROPOSAL LINK (CDC-Growth-Chart-Proposal - Google Docs)
A few things I’d genuinely like input on before I start:
1. Should WHO remain the default standard for all deployments, or should that be per-distro?
2. Nine CDC curves as published, or subset to five for visual parity with the WHO chart?
3. Would you rather extend WHO to its 5–19 reference than add CDC? Its weight-for-age component stops at 10 years, which is what led me to CDC — but that’s a deployment-context call, not a technical one.
4. Is turning the over-five empty state into a chart acceptable as default behaviour, or should it sit behind config for a release?
One unrelated thing I ran into and mention in the proposal: the stylesheet’s line-styling rules use the Carbon v10 `bx–` prefix, but `@carbon/[email protected]` only emits `cds–`, so the dashed reference curves and the bold patient line never actually apply. Happy to send that up as a small separate fix first if that’s easier to review.
I’m flexible on scope and happy to split this differently, or set it aside if it isn’t a priority right now. I’ll file a Jira ticket once there’s rough agreement on direction.
Thanks! @lumuchris256 @anjisvj @grace @jayasanka @dilankavishka