no no it should work it work for @ibacher when he pull my changes so something on my end will look in to it
I got the exact errors you reported when i pulled your fix-1 branch. That is why i told you to do the above.
Now the big question for me: what did I screw up in my environment so this worked? 
@ibacher it first worked for me just like it was for you. Until i did git pull fix-1
I did do that, but it looks like I modified my local copy of the hbm.xml file.
will it be a good try if upgrade the modules and retry. I hope there will be lot more errors then but am not sure ? wdyt ?
<openMRSVersion>1.9.8</openMRSVersion> <jacksonVersion>1.5.0</jacksonVersion> <oshiVersion>2.6-m-java7</oshiVersion> <appframeworkVersion>2.4</appframeworkVersion> <appuiVersion>1.3</appuiVersion> <syncVersion>1.2</syncVersion> <uicommonsVersion>1.8</uicommonsVersion> <uiframeworkVersion>3.4</uiframeworkVersion> <webservicesRestVersion>2.12</webservicesRestVersion>
So I was able to finally up and run the emr-monitor module
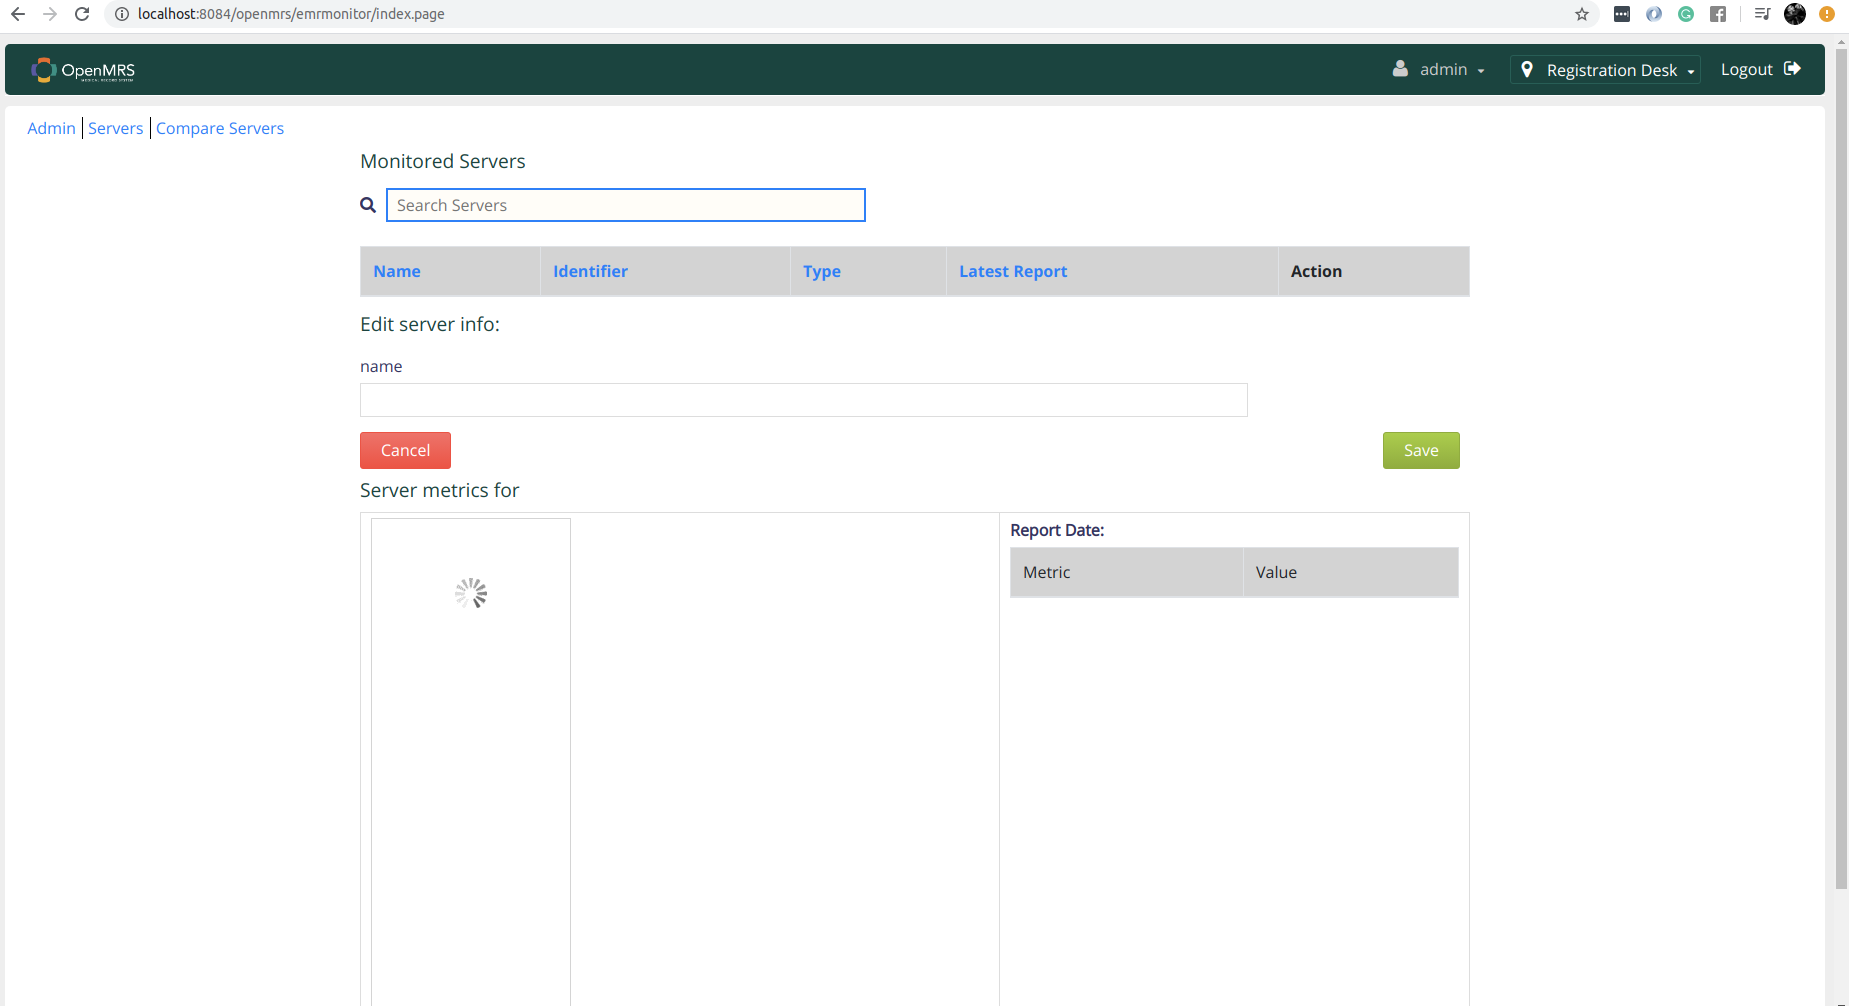
But actually things are not working pretty well it seems. There is this below error popping up always. Am using the ref app 2.10.0 release.
Attaching the error with a patebin. Any help here would be really helpful
O sorry i hadn’t seen this project and haven’t read all comments. i thought i could leave this here.
@Jembi worked on a system monitor module for Rwanda that is used there and i think Tanzania etc. it had a number of metrics too, you could try it and look for ways if you can harvest from it or support more metrics from it.
You can find it at GitHub - jembi/openmrs-module-systemmonitor but i guess the readme documentation wasn’t updated well. i have attached one that was still seating on my disk in search as last although not sure if it was.
JEMBIDEV-OpenMRSSystemMonitorModuleDocumentation-280618-1657.pdf (1.3 MB)
1 Like
Updated to use dbsessionfactory in emr-monitor module. Can we review the PR.
Sure I will go through this module now
Any specific configuration to be done in emrmonitor module to collect the metrics. Still I can’t see things in the UI after fixing the sessionfactory problem.
Hi @k.joseph it’s great actually I can seem almost all metrics collected. Using oshi seems to be great on collecting the system metrics.
When it comes to collecting data metrics related to resources its from querying the remote db right? . I think this part we need a bit of change we need a single point which stores all metrics related to openmrs resources in a single table. Because when we expose data in to a metric visualization ui dashboard we can’t query from various tables and then visualize. But if we can have a mechanism to store data in a single table in a rotation by executing the queries in the jembi module I think ti would be sufficient I think
WDYT ?
So I wonder if, for the purposes of OpenMRS, we really need to be concerned with operating system metrics. There are other tools for measuring those and I think it would be preferable to leverage those instead of repurposing OpenMRS into a general purpose system monitor. That said, there are useful things in the Jembi module and having some rolling metrics for “users this week”, “patients this week”, “patients last 7 days”, etc. could be very valuable.
Hi @ibacher
Still the activator issue there I added Maven build phases as well to unpack the api build files. Yet the issue persist.
I noticed few weired things like activator not in the omod file generated in mvn clean install. I added the build phase for poms and saw few goals like dependency unpack which takes metrics-api jar and extract it to the target classes in omod which seems like a needed phase to have the activator inside the omod. But actually it has this config
<configuration>
   <includeGroupIds>${project.parent.groupId}</includeGroupIds>
   <includeArtifactIds>${project.parent.artifactId}-api</includeArtifactIds>
   <excludeTransitive>true</excludeTransitive>
   <includes>**/*</includes>
   <outputDirectory>${project.build.directory}/classes</outputDirectory>
</configuration>
Which seems prettu fine for me but during the phase of installation
[INFO] --- maven-dependency-plugin:2.4:unpack-dependencies (Expand resources) @ metrics-omod ---
[INFO] Unpacking /home/ayesh/Desktop/oRMS/openmrs-module-metrics/api/target/metrics-api-1.0.0-SNAPSHOT.jar to /home/ayesh/Desktop/oRMS/openmrs-module-metrics/omod/target/classes with includes "*.xml,*.properties" and excludes ""
it was having only xml includes which is bit weired since the rule says to get all files  . I am not sure if this is because of some config issue.
I already pushed changes to the repo.Its in the below branch.
. I am not sure if this is because of some config issue.
I already pushed changes to the repo.Its in the below branch.
Hi @ibacher @mseaton @judeniroshan
I wanted to access the category filtered feed from atomfeed module. It should be http://localhost:8084/openmrs/atomfeed/patient/recent accessible by this end point as per the rest controller.
Also I tried out the documentation it says the feed can be accessible by this link but am not sure why it’s not there as well http://localhost:8084/openmrs/moduleServlet/atomfeed/atomfeed
I added basic jmx reports flows to the pr.
Btw dont we need to expose metrics from an endpoint like
localhost:8080/metrics/metricdata will give set of metic data we provide
I think inorder to achieve this we need to support metricserverlet wdyt ?
1 Like
@ayesh nice work… I’ll check the PR 
Hm Its the same @ibacher
Btw
wdyt abt this
https://mvnrepository.com/artifact/io.prometheus/simpleclient_dropwizard
And I saw there is a graphite reporter as well
I didnt dig deep but I feels like it will affect the performace of the app for sure
I will get an idea weather its possible to pull every 1 hour or 30 mins time than always doing the pulling
That looks like it could be a cool add-on to have. I think the first thing is to make sure we have the metrics publishable in some format. I would think we want to leave the stack consuming the metrics as open as possible, although I suppose integrating something for some viewable dashboards might be cool.