Then I misunderstood completely what Docker was for 
After reading https://www.docker.com/what-docker now it’s clear.
Thanks
Then I misunderstood completely what Docker was for
After reading https://www.docker.com/what-docker now it’s clear.
Thanks
Yes, it was demo-2.0.1.sql.zip
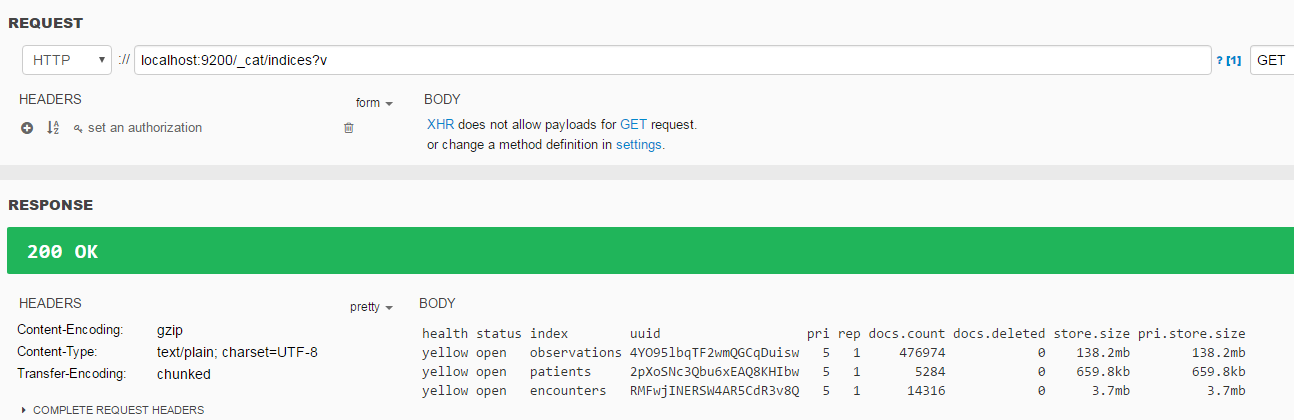
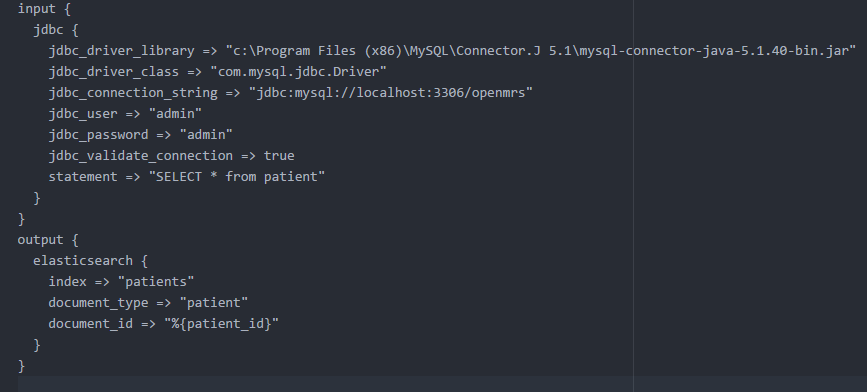
I loaded patients, encounters and obs into EL using Logstash:
Config file to load patients is as simple as :
Thanks @lluismf for reporting back. In the response you pasted I see you imported observations and encounters in addition to patients. It’s ~140 MB all together, which isn’t too bad for 5k patients and 500k obs. How long did it take? I can’t wait to see Kibana in action with that data. Will you be setting it up too?
Patients and encounters almost instantly, observations about 15 minutes. But the raw data I’m pretty sure is not enough for the graphs you want, I will need to iterate through the queries to ensure the indexes have proper data.
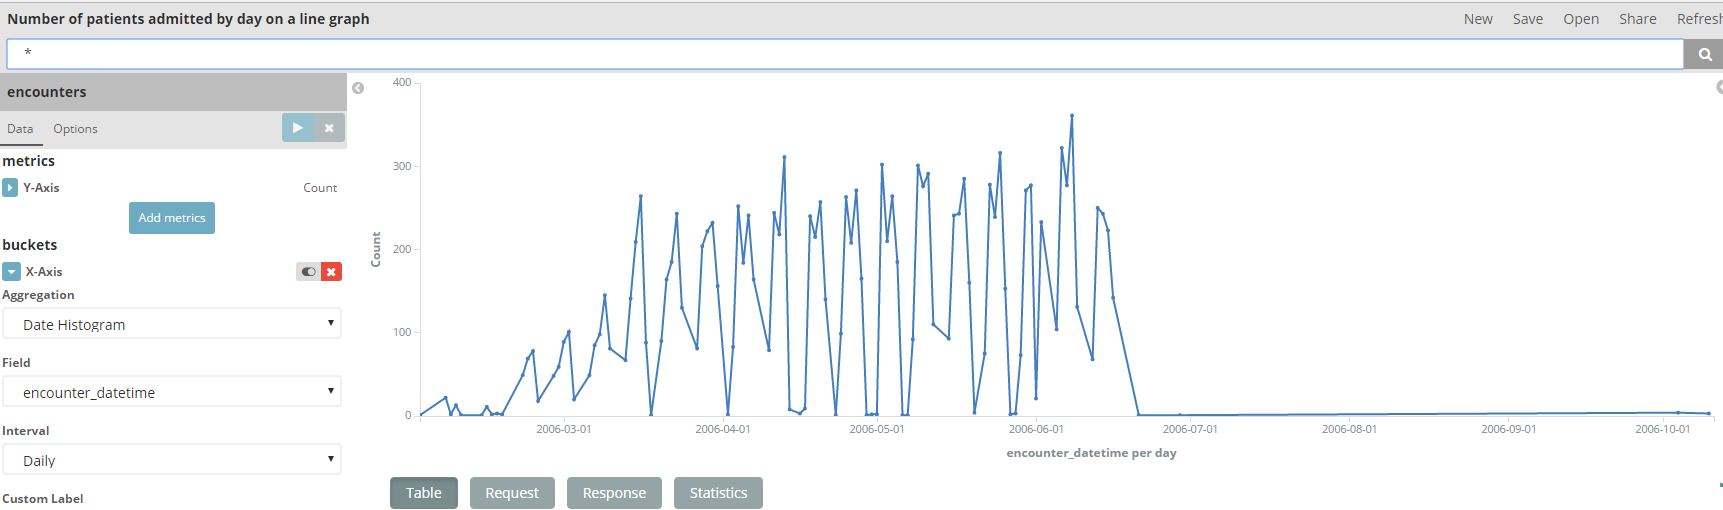
- Number of patients admitted by day on a line graph Maybe the encounter is enough (there’s ony patient_id in encounter)
- Diagnoses frequency pie chart Probably need to join encounters with concepts as diagnosis is a subset of concepts.
- Number of patients by origin on a map Need to join patients with address. Then add geolocation attributes somewhere.
Yes, I expected joins. You will want to join obs with concepts. Regardless 15 minutes is quite promising for initial setup… Is logstash able to pick up updates when configured that way? When I create a new obs, what does it take to update data in EL? Does it happen automatically asynchronously?
No AFAIK, the query must be intelligent enough to detect the newly updated rows since the last execution. All our tables are fortunately audited, we just need to keep track of the last execution.
I don’t know, probably immediate (near real time, because EL indexes asynchronously).
You can specify a cron expression in the CONF file. If you don’t like polling, another option is whenever an entity is inserted/updated/deleted write the event in a JMS queue and implement the synchronization with EL there. But in this case LogStash would be useless. In the end if you want higher control (Logstash has many limitations) you’ll end up with a custom synchronization process.
Cool! Can this be included in a Kibana dashboard of some sort? And if so, what then happens when the user clicks on it?
The graph is called a “visualization”. Once you have visualizations defined you can create dashboards easily with drag&drop.
When you click on a value if performs a drill down but still I don’t know it well.
Demo data is not good regarding diagnoses. If I’m not wrong, diagnosis are observations whose concept has class = 4
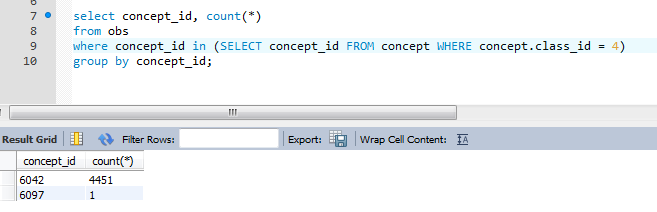
Do we have a better demo database? Otherwise I’m going to randomly update obs to assign diagnoses.
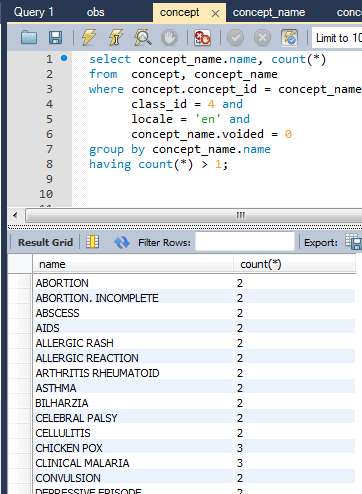
Another problem is diagnoses with multiple concept names where none is preferred.
The pair of you should contact Jan (in response to Data analysis tool - #2 by janflowers).
But it’s going to be slower than you’d like to get actual deidentified data from an implementation that has expressed interest. I recommend that @raff follows up on that lead, and @lluismf goes ahead and generates some random diagnoses.
I would not approach it this way.
So, the demo data that you’re using is based off an old OpenMRS approach and concept dictionary, and it’s not what we current recommend to people. (This could also explain the concepts without a preferred name situation.)
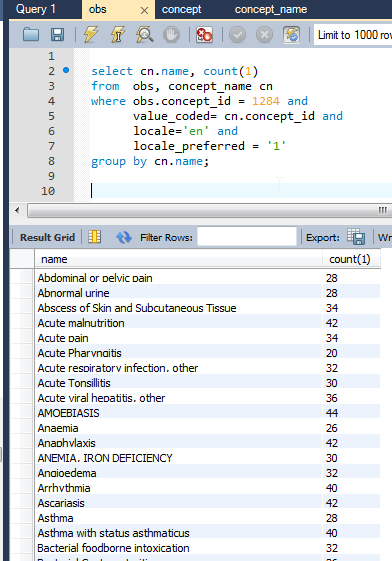
It would be better to use the reference application + the CIEL dictionary (or just the subset that’s packaged with the refapp) + reference demo data. This will auto-generate diagnoses, with the right structure. In that structure you’d want to look for obs where concept_id = 1284. (technically it should really be obs where obs.concept has a SAME-AS mapping to “org.openmrs.module.emrapi:Coded Diagnosis” but I would ignore this during the spike).
@lluismf, the demo data I linked before (https://github.com/openmrs/openmrs-contrib-ansible-docker-compose/blob/master/files/demo/dbdump/demo-refapp-2.5.sql) is generated the way Darius described. Please try that instead.
@darius, we have an initial discussion with the Mozambique team scheduled for tomorrow.
Just to make it clear, https://github.com/openmrs/openmrs-contrib-ansible-docker-compose/blob/master/files/demo/ is docker-compose of our demo.openmrs.org
If you want me to deploy an ELK (or whatever combination of services) to our infra, I’d kindly ask it to be dockerised and to follow https://github.com/openmrs/openmrs-contrib-ansible-docker-compose/blob/master/README.md (it’s not clear from this topic if that’s going to happen).
@cintiadr, we may want to demo Kibana in the future, but we’re not quite yet ready, thanks!
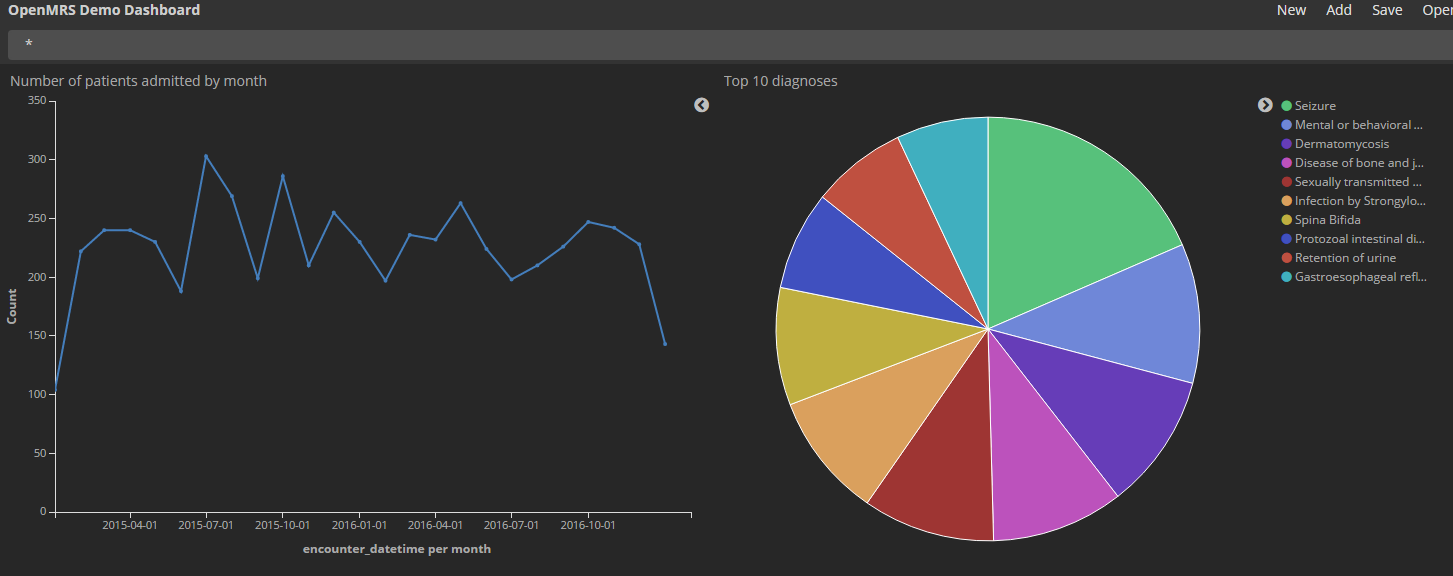
I’ve imported the demo-refapp dump as Rafal suggested and data is now ok:
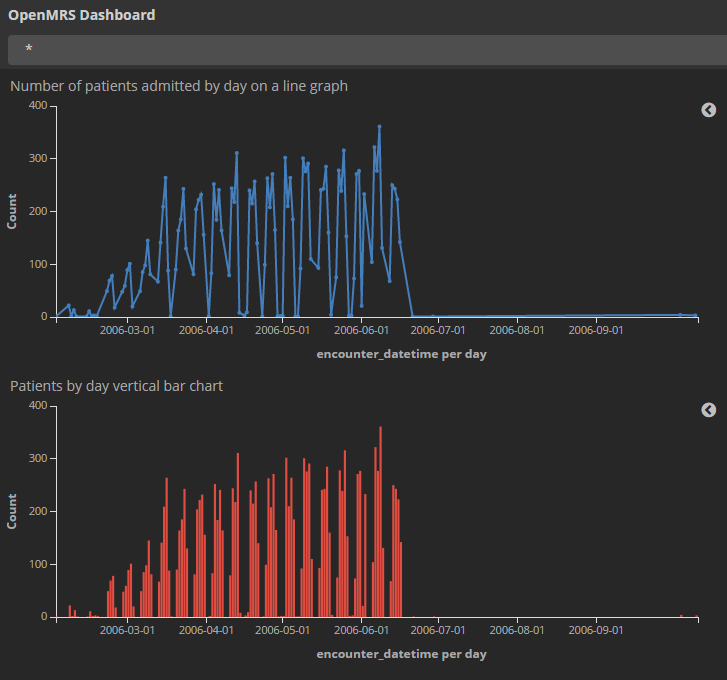
Current dashboard:
There are 208 distinct diagnoses with similar distribution, I picked the top 10. You can configure the number in the graph definition.
The pie charts is bare bones (like Google Charts) but maybe it’s enough. No 3D charts with animated sections and all that stuff.
Keep it coming Lluis! Looks great so far! Is the Kibana config (dashboard you created) easily shareable so I can run it locally?
I’ve uploaded Logstash config files and Kibana artifacts here
A couple of things:
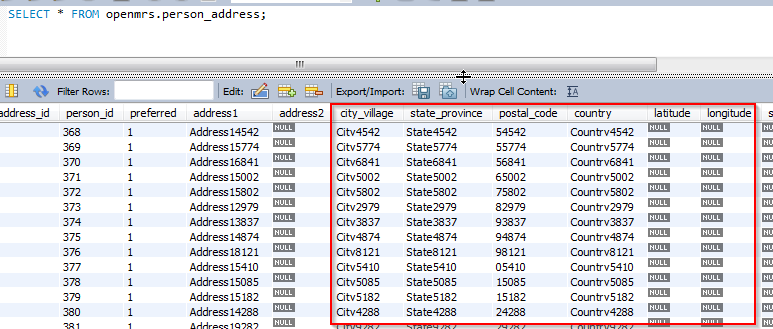
In order to use Kibana’s Tile Maps I need to index person addresses converting latitude + longitude to geolocation points. It’s easy to do in Logstash, using a transformation filter, and we already have these fields in person_address, but they are NULL and the cities are fake.
I guess my only option is to update addresses with real cities and coordinates, right?
In practice real OpenMRS installations will rarely have the lat/long fields populated. So this would need to happen in the ETL process or something.
-Darius (by phone)
I entered the coordinates manually:
update person_address set city_village=‘Barcelona’, latitude=41.385064, longitude=2.173403 where person_address_id between 1 and 100;
update person_address set city_village=‘Nairobi’, latitude=-1.292066, longitude=36.821946 where person_address_id between 101 and 200;
update person_address set city_village=‘Kampala’, latitude=0.347596, longitude=32.582520 where person_address_id between 201 and 300;
update person_address set city_village=‘Berlin’, latitude=52.520007, longitude=13.404954 where person_address_id between 301 and 400;
update person_address set city_village=‘Bombay’, latitude=19.075984, longitude=72.877656 where person_address_id between 401 and 500;
The map is as follows (it doesn’t work properly, all circles should be of equal size)