Hi @k_joseph and all !
Often we have cases where we would like to set the Chart Search graph date range. For instance, when a patient stays for a long period in the hospital, and his temperature is recorded twice daily, the graph of the chart search becomes useless because its date range is from the first observation date, to the latest one. So we can’t really see the evolution of the temperature for a shorter period.
See the screenshot:
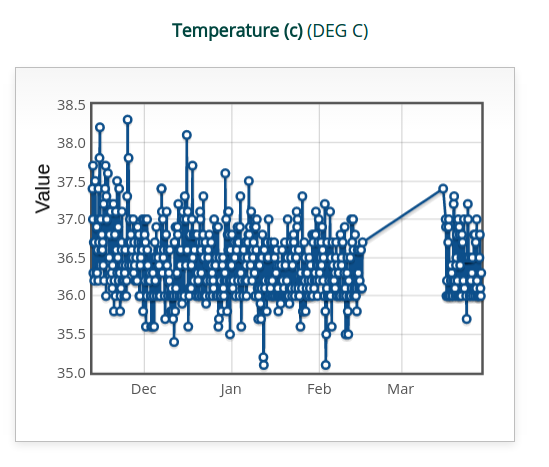
(The situation would be even worse if the patient comes back the next year for instance)
Could we add some filters on the graph to narrow down the date range ?
Note: I see there is already a time filter, but it seem to filter just the search results, not the charting.
Thanks
Romain